Fig. B.1.
Download original image
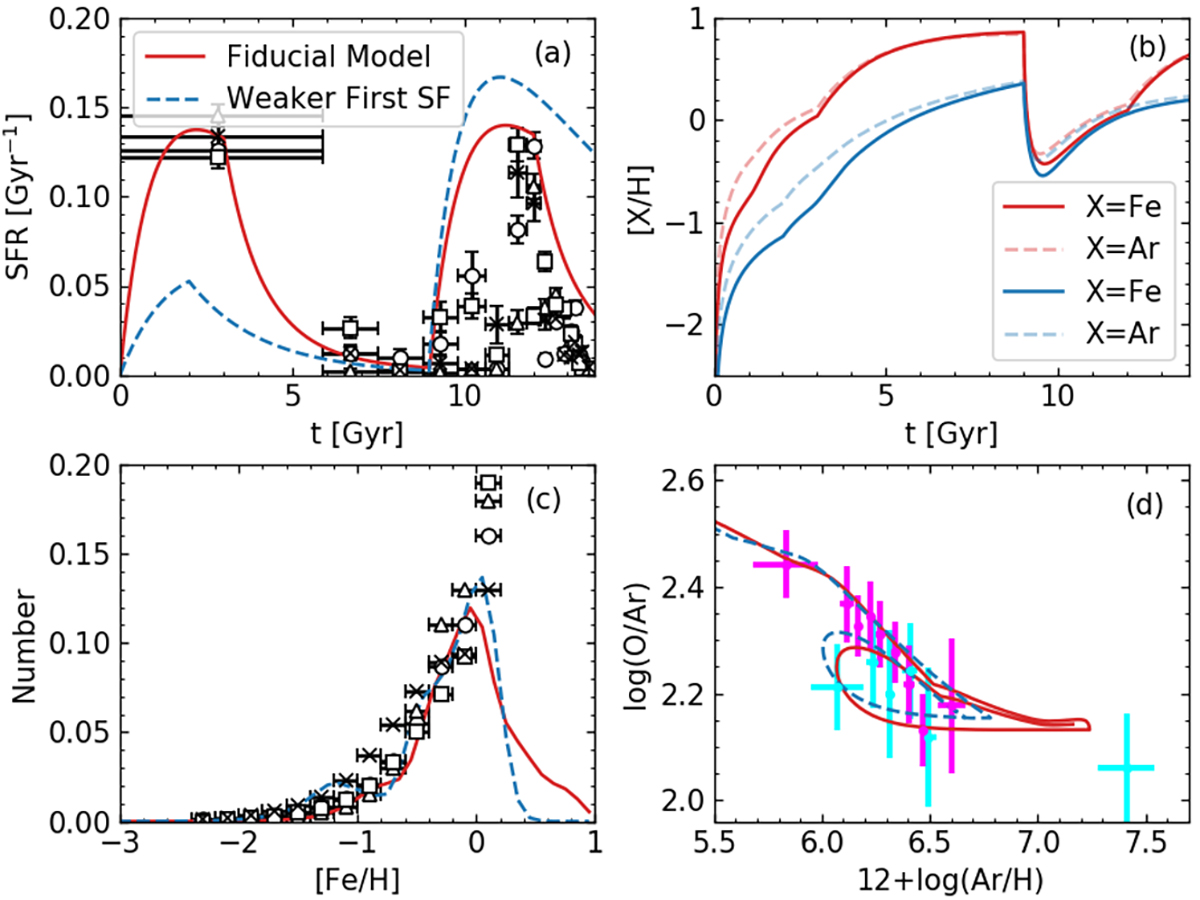
Chemical evolution model in the 2 ≤ RGC ≤ 14 disc region. (a) Star formation history, compared to the observational results from Williams et al. (2017). (b) Evolution of iron (red and blue lines) and argon (light red and blue lines) abundances in the ISM. (c) Metallicity distribution function, compared to the observational results from Williams et al. (2017). (d) O/Ar–Ar/H relation, compared to our PN sample; magenta for low-extinction PNe over the entire M31 disc (RGC = 2–30 kpc) and cyan for high-extinction PNe at RGC < 14 kpc (same as in Fig. 7).
Current usage metrics show cumulative count of Article Views (full-text article views including HTML views, PDF and ePub downloads, according to the available data) and Abstracts Views on Vision4Press platform.
Data correspond to usage on the plateform after 2015. The current usage metrics is available 48-96 hours after online publication and is updated daily on week days.
Initial download of the metrics may take a while.