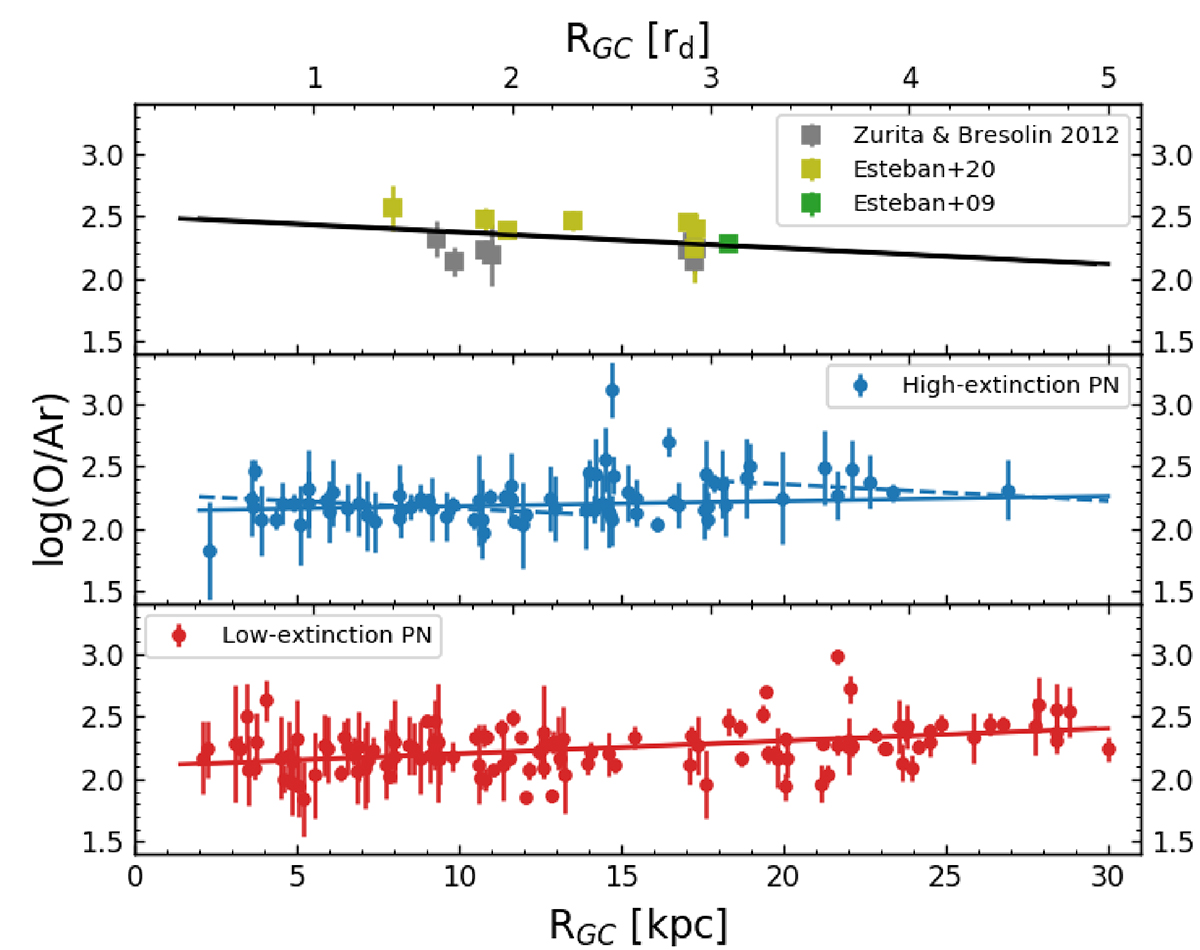
Fig. 1.
Download original image
Galactocentric radial distribution of log(O/Ar) values for HII regions (top) and for high- and low-extinction PNe (middle and bottom, respectively) in the M31 disc from the PN catalogue published in Paper IV. The best-fitting radial log(O/Ar) gradient is shown for HII regions (black) and high- (blue) and low-extinction (red) PNe. Middle panel: displays three independent linear fits for three radial ranges: the solid line is the linear fit to the entire dataset; for within 14 kpc and beyond 18 kpc, the linear fits are shown with dashed lines.
Current usage metrics show cumulative count of Article Views (full-text article views including HTML views, PDF and ePub downloads, according to the available data) and Abstracts Views on Vision4Press platform.
Data correspond to usage on the plateform after 2015. The current usage metrics is available 48-96 hours after online publication and is updated daily on week days.
Initial download of the metrics may take a while.