Fig. 9
Download original image
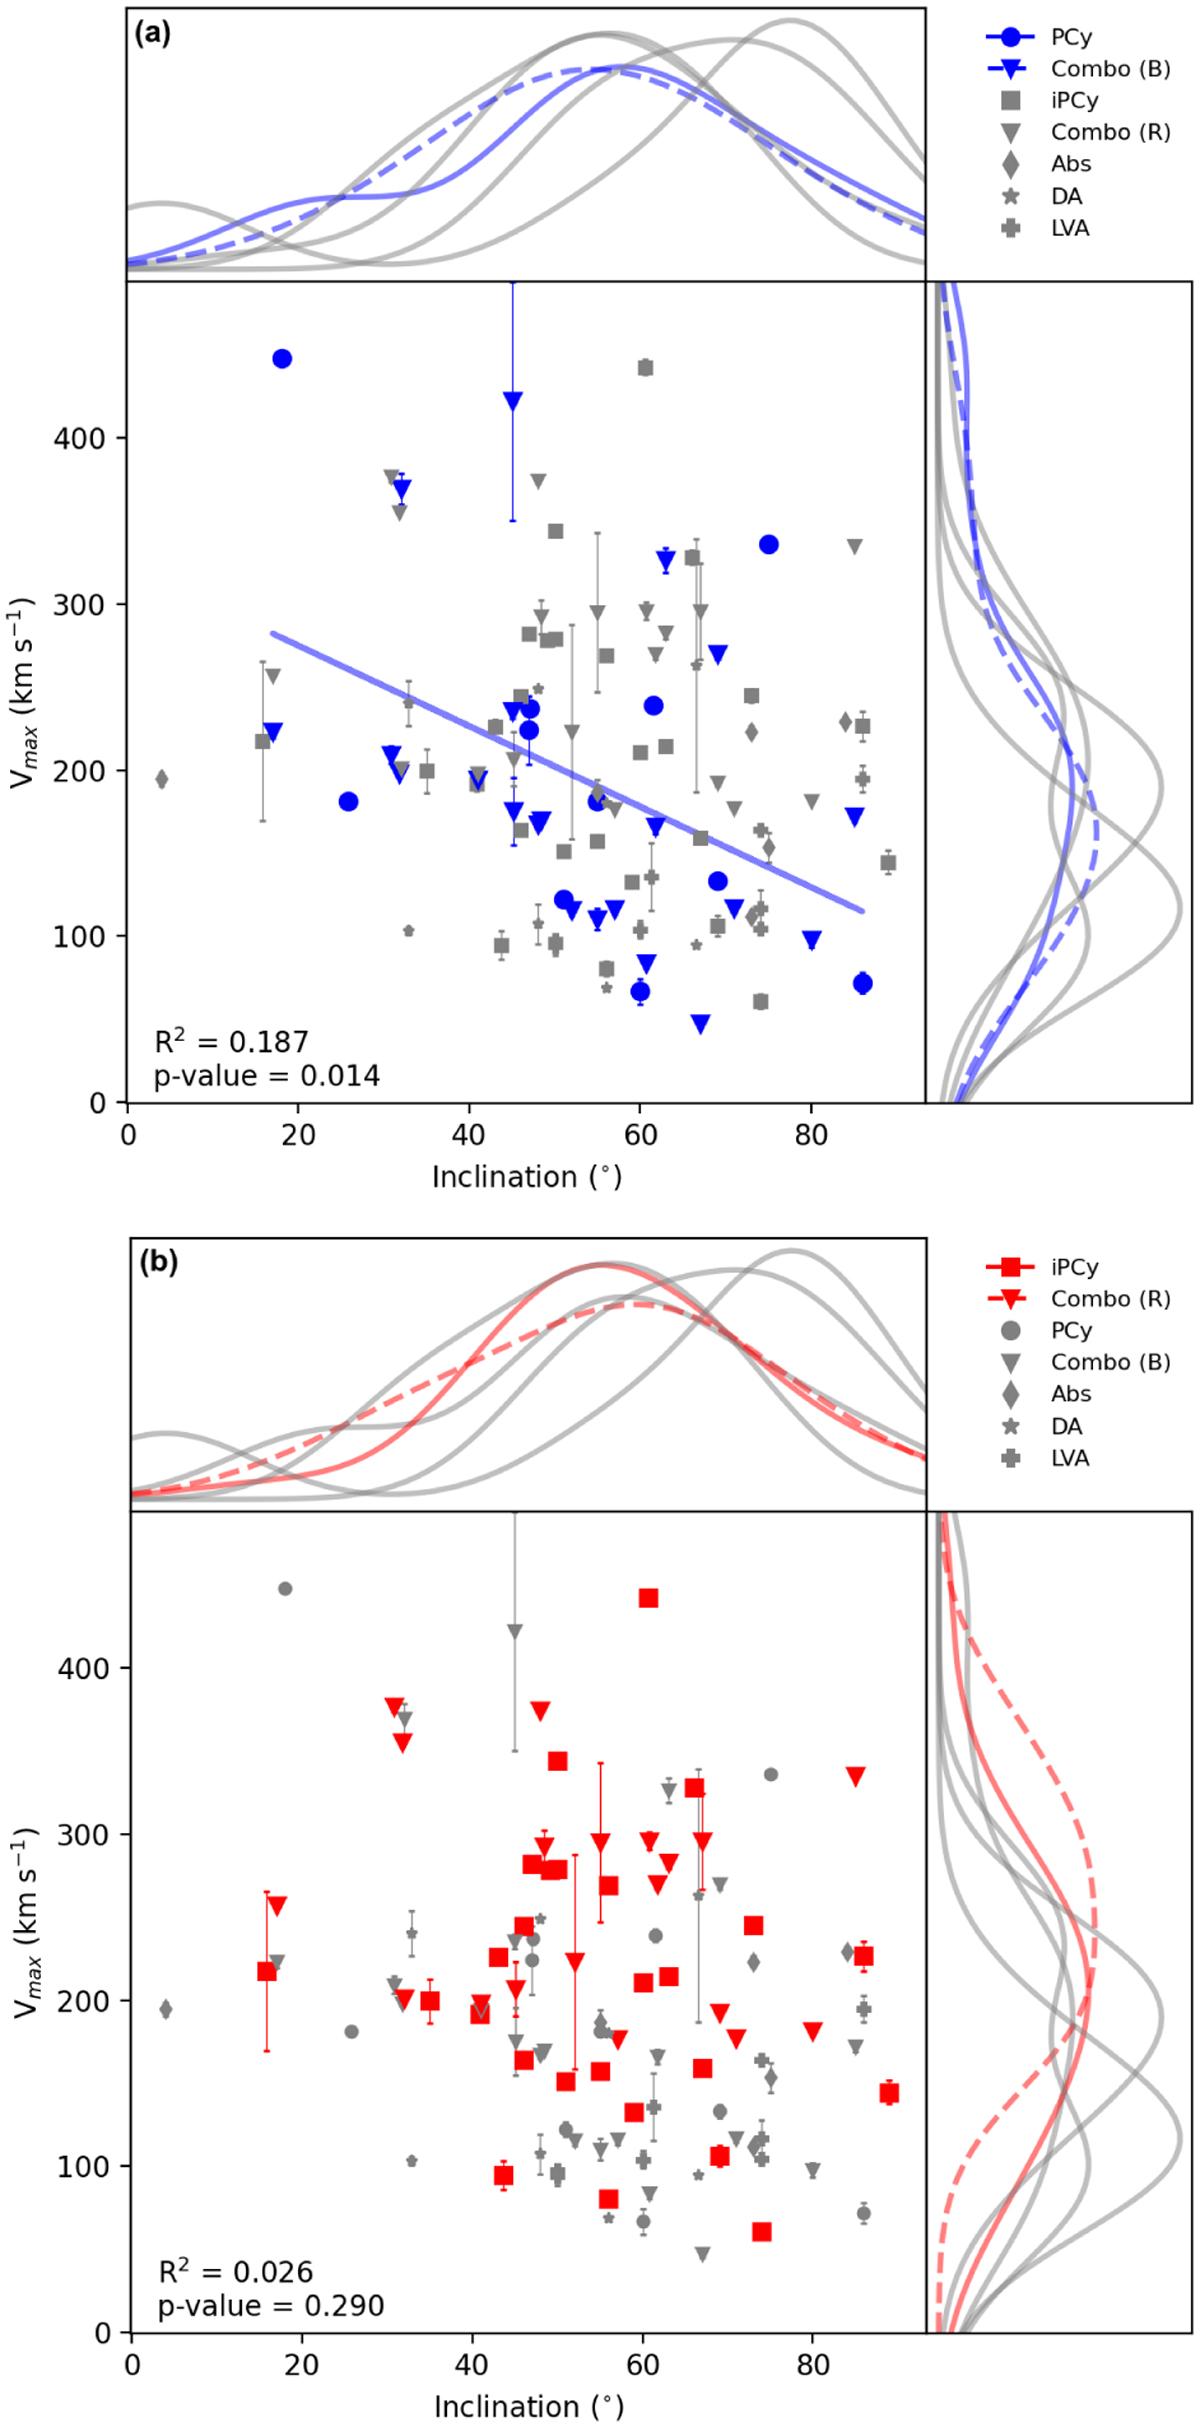
Source inclinations with respect to the maximum velocities of observed absorption features (a) for the blue absorption features in P Cygni and combination profiles, and (b) for the red absorption features in inverse P Cygni and combination profiles in our sample. All other profile types are displayed in grey. The curves along the top and right-hand side are the kernel density estimation (KDE) of each profile type.
Current usage metrics show cumulative count of Article Views (full-text article views including HTML views, PDF and ePub downloads, according to the available data) and Abstracts Views on Vision4Press platform.
Data correspond to usage on the plateform after 2015. The current usage metrics is available 48-96 hours after online publication and is updated daily on week days.
Initial download of the metrics may take a while.