Fig. 8
Download original image
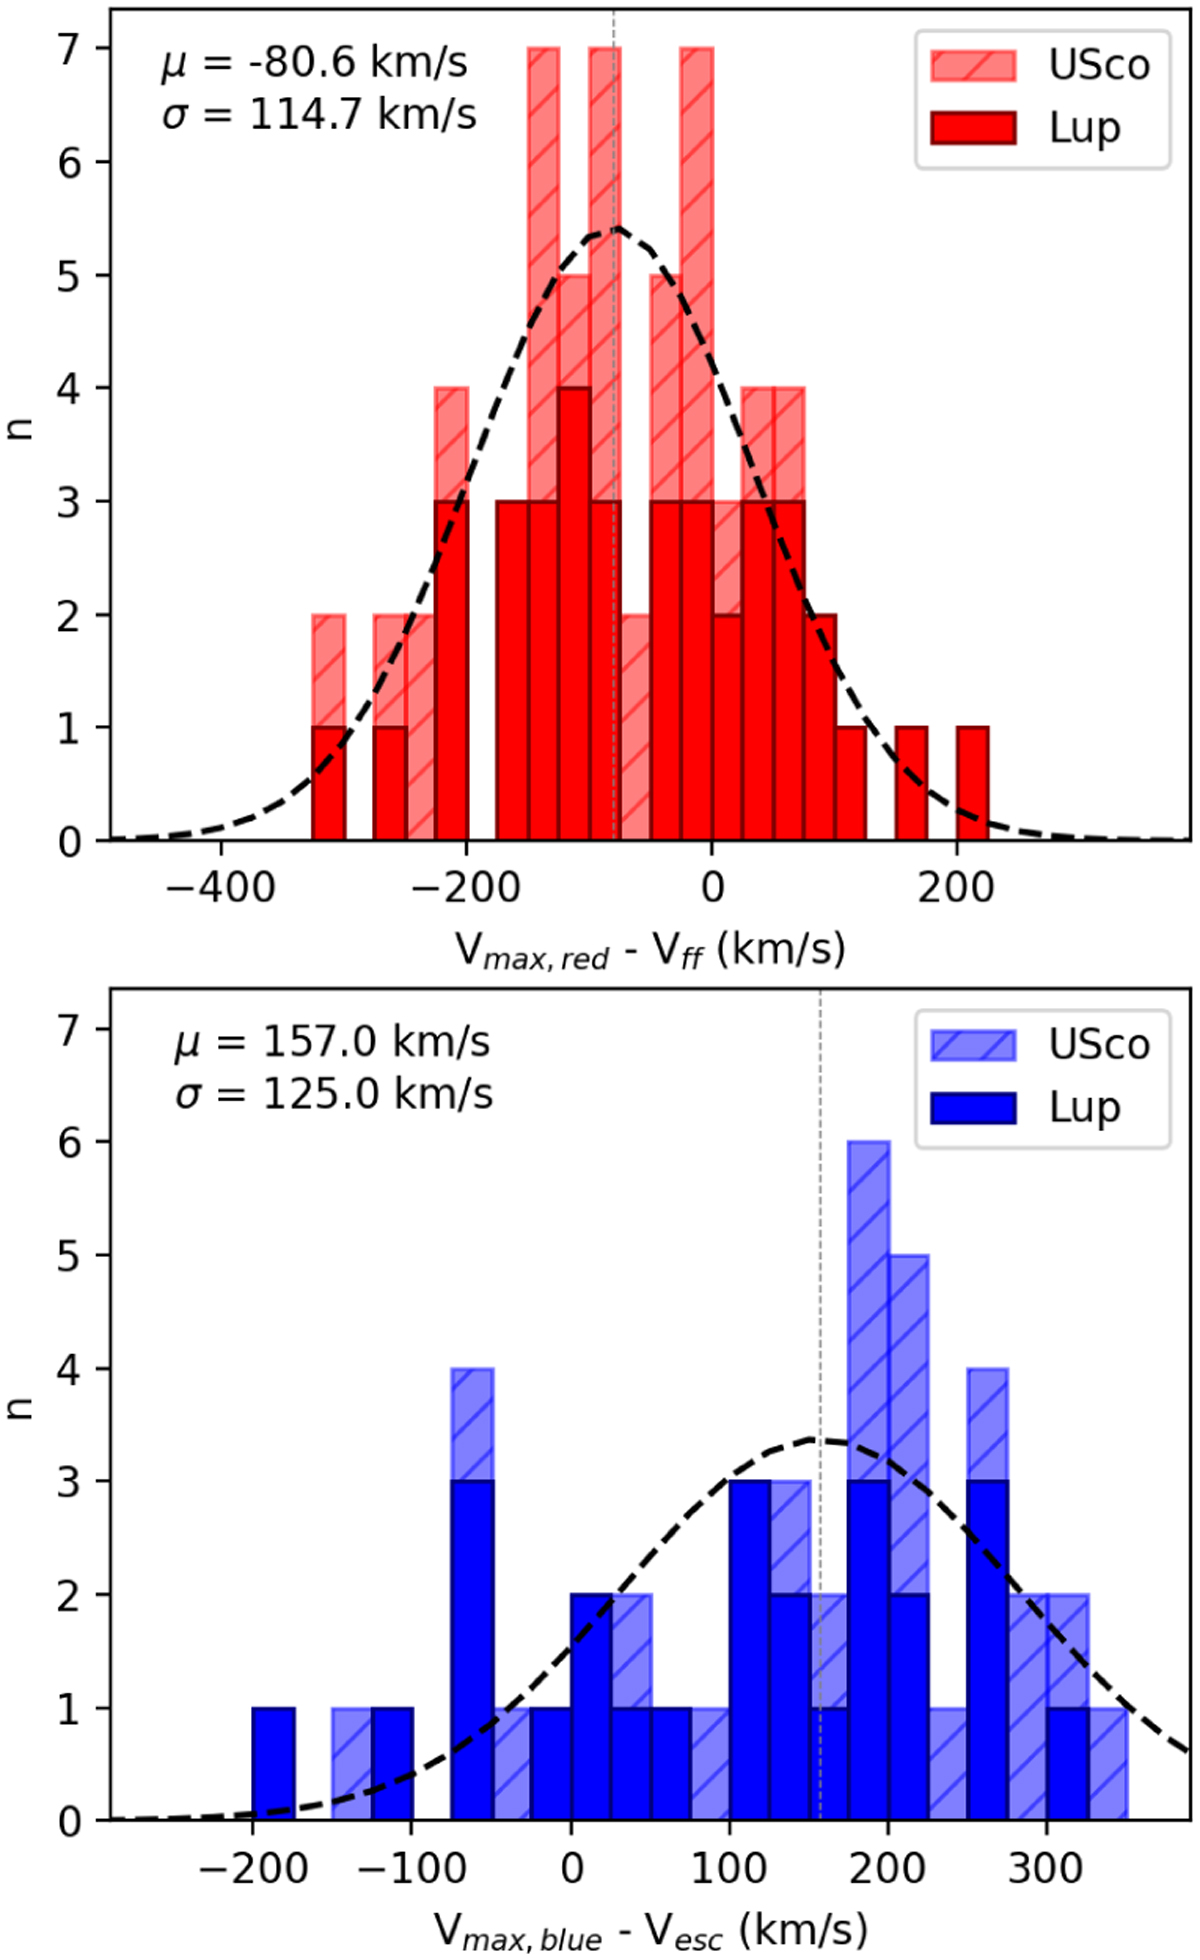
Stacked histograms of the observed red-shifted maximum velocities compared to the free-fall velocities (top), and blue-shifted maximum velocities compared to the escape velocity (bottom), where the total value in each bin is the number of sources in both Lupus and Upper Scorpius. The dashed black line in each panel shows the Gaussian distributions fitted to the histogram data, with the centroid (µ) and standard deviation (σ) of this fit noted in the top left corner.
Current usage metrics show cumulative count of Article Views (full-text article views including HTML views, PDF and ePub downloads, according to the available data) and Abstracts Views on Vision4Press platform.
Data correspond to usage on the plateform after 2015. The current usage metrics is available 48-96 hours after online publication and is updated daily on week days.
Initial download of the metrics may take a while.