Fig. 6
Download original image
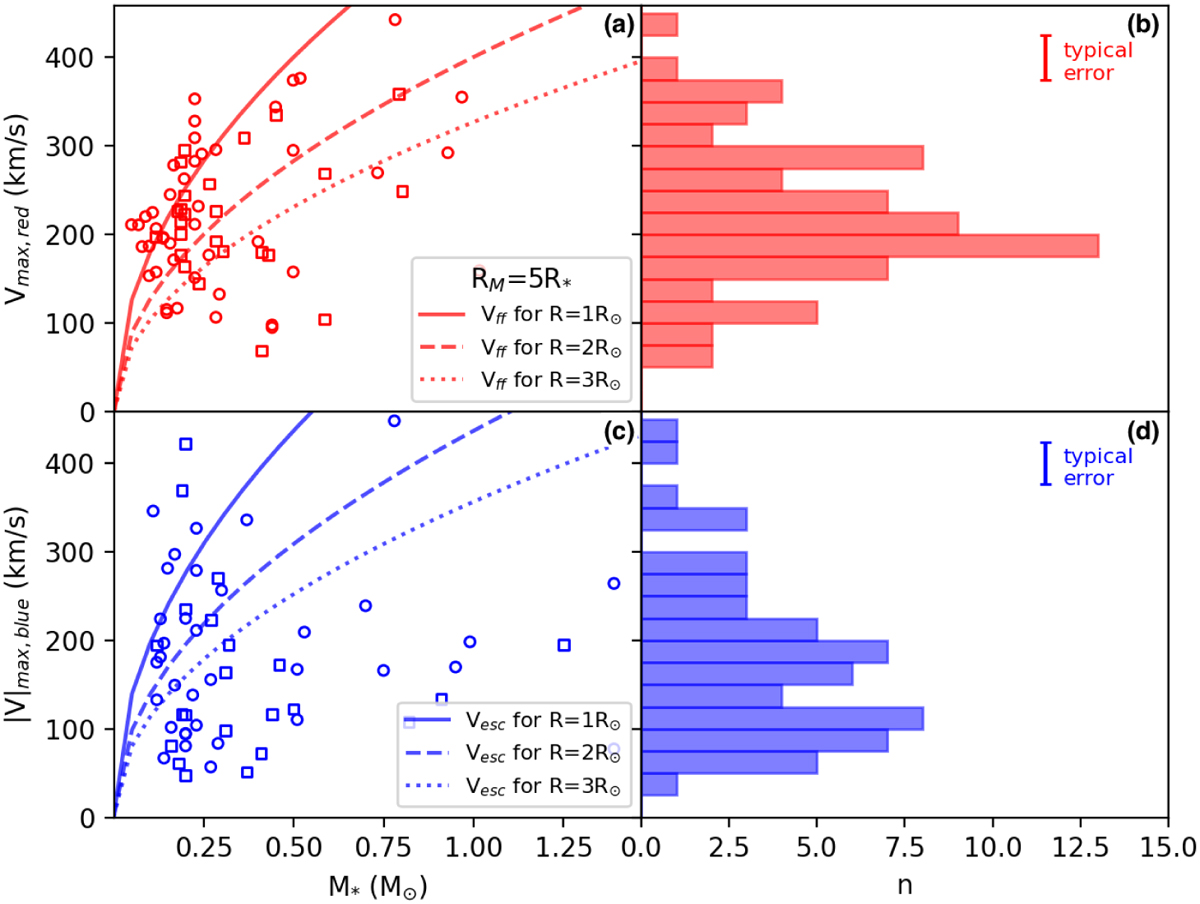
Maximum velocities of the red- and blue-shifted absorption features (panels a and c, respectively) observed in the He I λ10830 Å profiles. Panels a and c: scatter plots of the Lupus absorption velocities with circles, and Upper Scorpius velocities with squares. The solid, dashed and dotted lines are the free-fall velocities (panel a) and escape velocities (panel c) for stellar radii R* = 1, 2, 3 R⊙, respectively. Panels b and d: histograms of the maximum absorption velocities for both regions in 10 km s−1 velocity bins.
Current usage metrics show cumulative count of Article Views (full-text article views including HTML views, PDF and ePub downloads, according to the available data) and Abstracts Views on Vision4Press platform.
Data correspond to usage on the plateform after 2015. The current usage metrics is available 48-96 hours after online publication and is updated daily on week days.
Initial download of the metrics may take a while.