Fig. B.1
Download original image
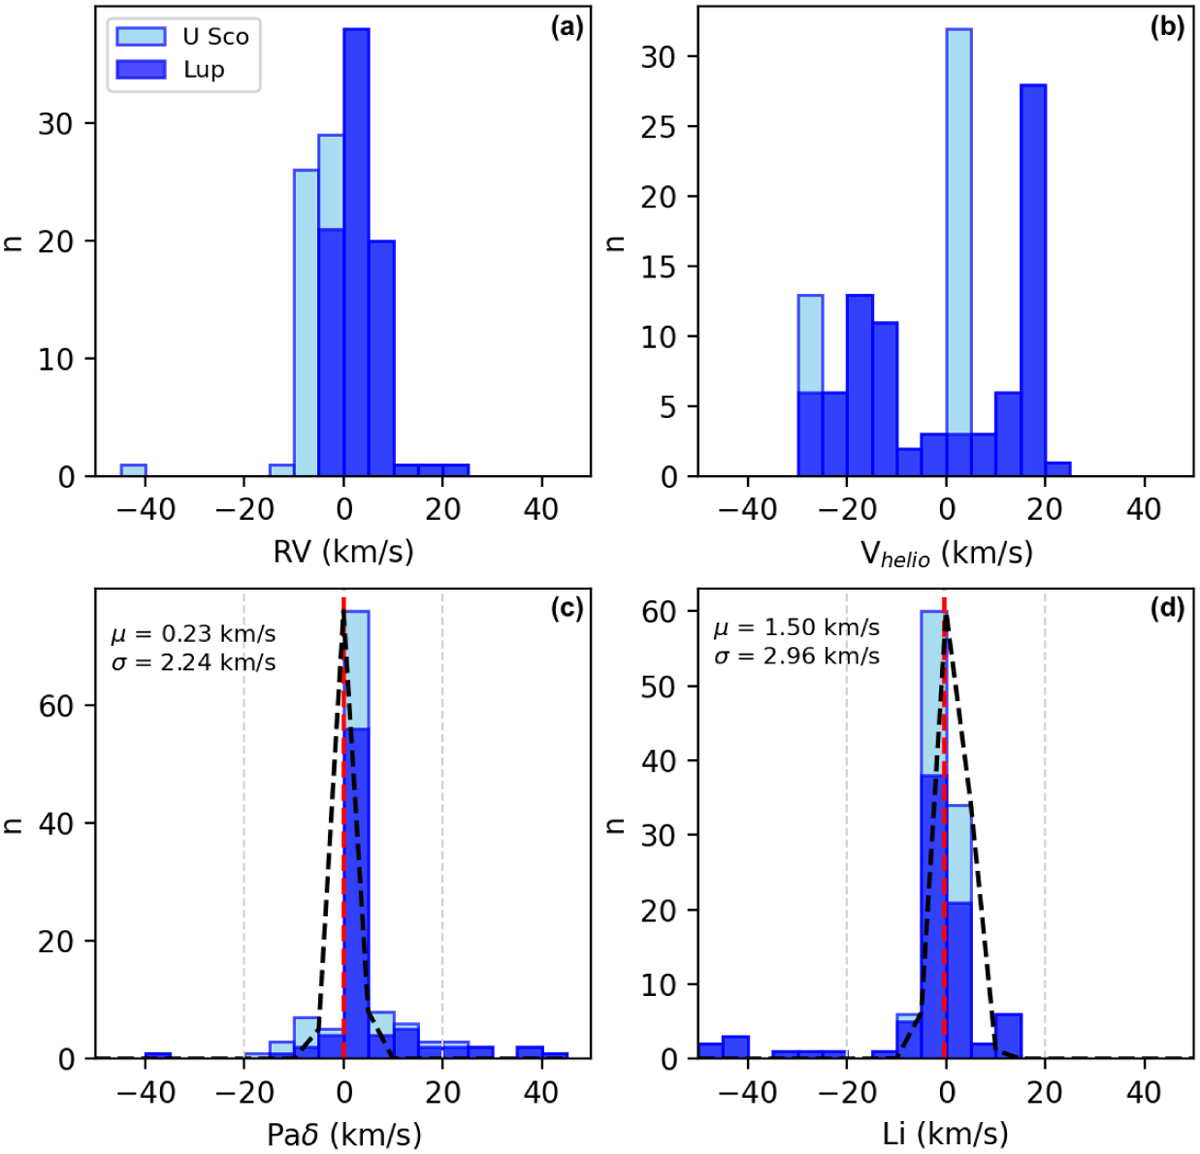
Histograms of the velocity corrections applied to the spectra for sources in both star forming regions. Panels (a) and (b) show the radial velocity and the heliocentric velocity corrections. Panels (c) and (d) show the velocity corrections measured from the Paδ and Li lines. The red dashed line marks the median value of the Paδ and Li shifts, with the corresponding mean and standard deviation listed in each panel.
Current usage metrics show cumulative count of Article Views (full-text article views including HTML views, PDF and ePub downloads, according to the available data) and Abstracts Views on Vision4Press platform.
Data correspond to usage on the plateform after 2015. The current usage metrics is available 48-96 hours after online publication and is updated daily on week days.
Initial download of the metrics may take a while.