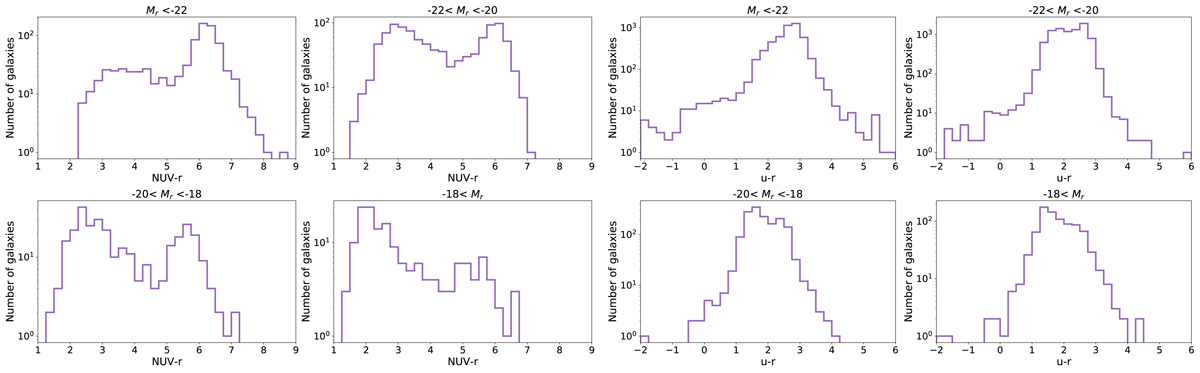
Fig. 9.
Download original image
Comparison of the NUV−r and u − r absolute color distributions for all MorCat ∩ GALEX galaxies with aspect ratio ≥0.61, in bins of absolute r band magnitude, using SExtractor photometry data. Left: the distribution of NUV−r colors shows the bimodality caused by the presence of the Green Plain for all absolute magnitude intervals. Right: the Green Plain, hence the bimodality disappear in the distributions of u − r colors for all r intervals.
Current usage metrics show cumulative count of Article Views (full-text article views including HTML views, PDF and ePub downloads, according to the available data) and Abstracts Views on Vision4Press platform.
Data correspond to usage on the plateform after 2015. The current usage metrics is available 48-96 hours after online publication and is updated daily on week days.
Initial download of the metrics may take a while.