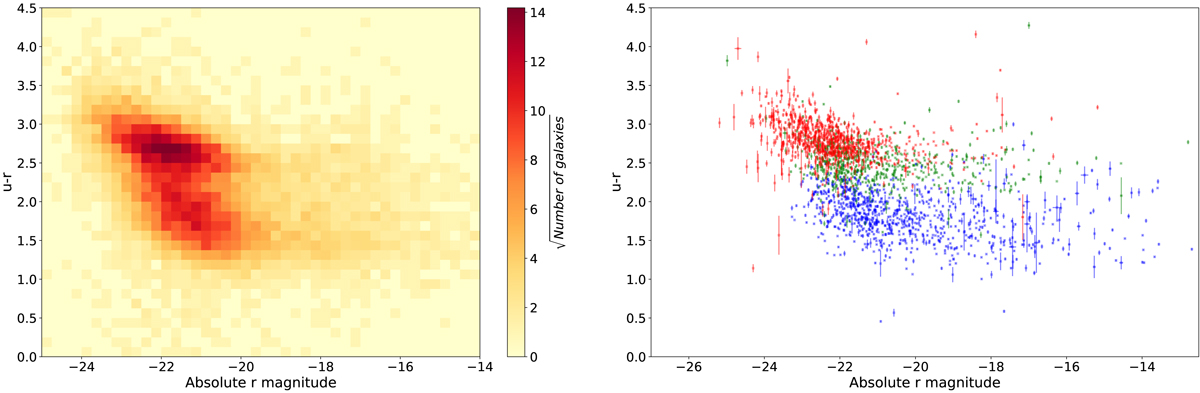
Fig. 8.
Download original image
Color-magnitude diagram for all MorCat galaxies with aspect ratio ≥0.61 using the absolute optical color u − r and the absolute magnitude in the r band, from the SExtractor photometry. Left: number of galaxies in cells of both color and magnitude. Each cell has a width of 0.25 and a height of 0.125 dex. Right: individual galaxies are plotted in blue for the Blue Cloud (NUV−r < 3.77), green for the Green Plain (NUV−r ∈ [3.77, 5.71]) and red in the Red Sequence (NUV−r > 5.71). The dichotomy between the Red Sequence and the Blue Cloud is still present but the Green Plain seen in NUV−r (Fig. 4) has disappeared, being superimposed on the Red Sequence.
Current usage metrics show cumulative count of Article Views (full-text article views including HTML views, PDF and ePub downloads, according to the available data) and Abstracts Views on Vision4Press platform.
Data correspond to usage on the plateform after 2015. The current usage metrics is available 48-96 hours after online publication and is updated daily on week days.
Initial download of the metrics may take a while.