Fig. 6.

Download original image
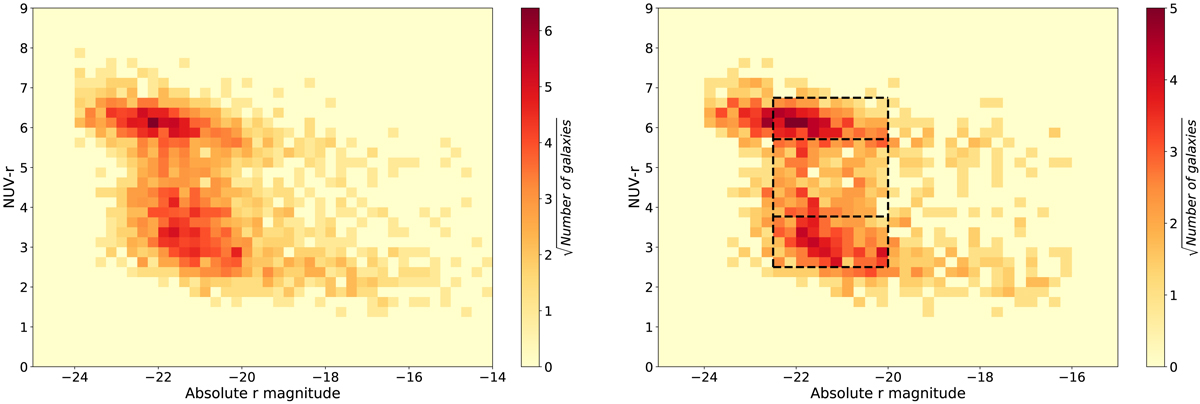
MorCat color-magnitude diagrams in square cells of color and magnitude of length 0.25. To retrieve a representative picture of nearby galaxies, galaxies were randomly drawn from the MorCat ∩ GALEX sample in 1 mag intervals of Mr, in order to match the Mr distribution of MorCat. Left panel: distribution of all MorCat galaxies, whereas the right panel is restricted to galaxies with an aspect ratio ≥0.61, in order to exclude highly inclined and edge-on disks. Both graphs display the bimodal distribution of galaxy population with the two density peaks of the Red Sequence and the Blue Cloud, separated by the Green Valley or Green Valley. The dashed lines in the right panel delimit the regions of the Red Sequence, the Green Valley, and the Blue Cloud that are respectively used in Sect. 4.1.2 to illustrate the stretching of the NUV−r that generates the Green Valley, and lead us to rename it Green Plain.
Current usage metrics show cumulative count of Article Views (full-text article views including HTML views, PDF and ePub downloads, according to the available data) and Abstracts Views on Vision4Press platform.
Data correspond to usage on the plateform after 2015. The current usage metrics is available 48-96 hours after online publication and is updated daily on week days.
Initial download of the metrics may take a while.


