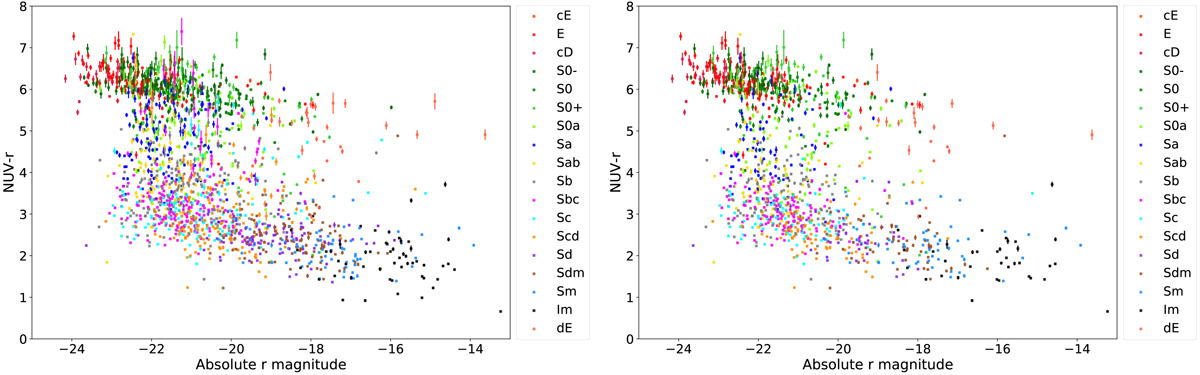
Fig. 4.
Download original image
Color-magnitude diagram defined as NUV−r absolute color versus r absolute magnitude for the 1848 EFIGI ∩ GALEX galaxies at all inclinations (left panel), and with Incl-Elong ≤ 2 (right panel). The color of the points indicates their Hubble type as classified in the EFIGI morphological catalog. The distributions of galaxies in both graphs exhibit the bimodality between the ellipticals and lenticulars in the upper region (the Red Sequence), and spirals of type Sab and later in the lower region (the Blue Cloud). A lower density region (the Green Valley) connects both structures, with galaxies of types S0a and Sa.
Current usage metrics show cumulative count of Article Views (full-text article views including HTML views, PDF and ePub downloads, according to the available data) and Abstracts Views on Vision4Press platform.
Data correspond to usage on the plateform after 2015. The current usage metrics is available 48-96 hours after online publication and is updated daily on week days.
Initial download of the metrics may take a while.