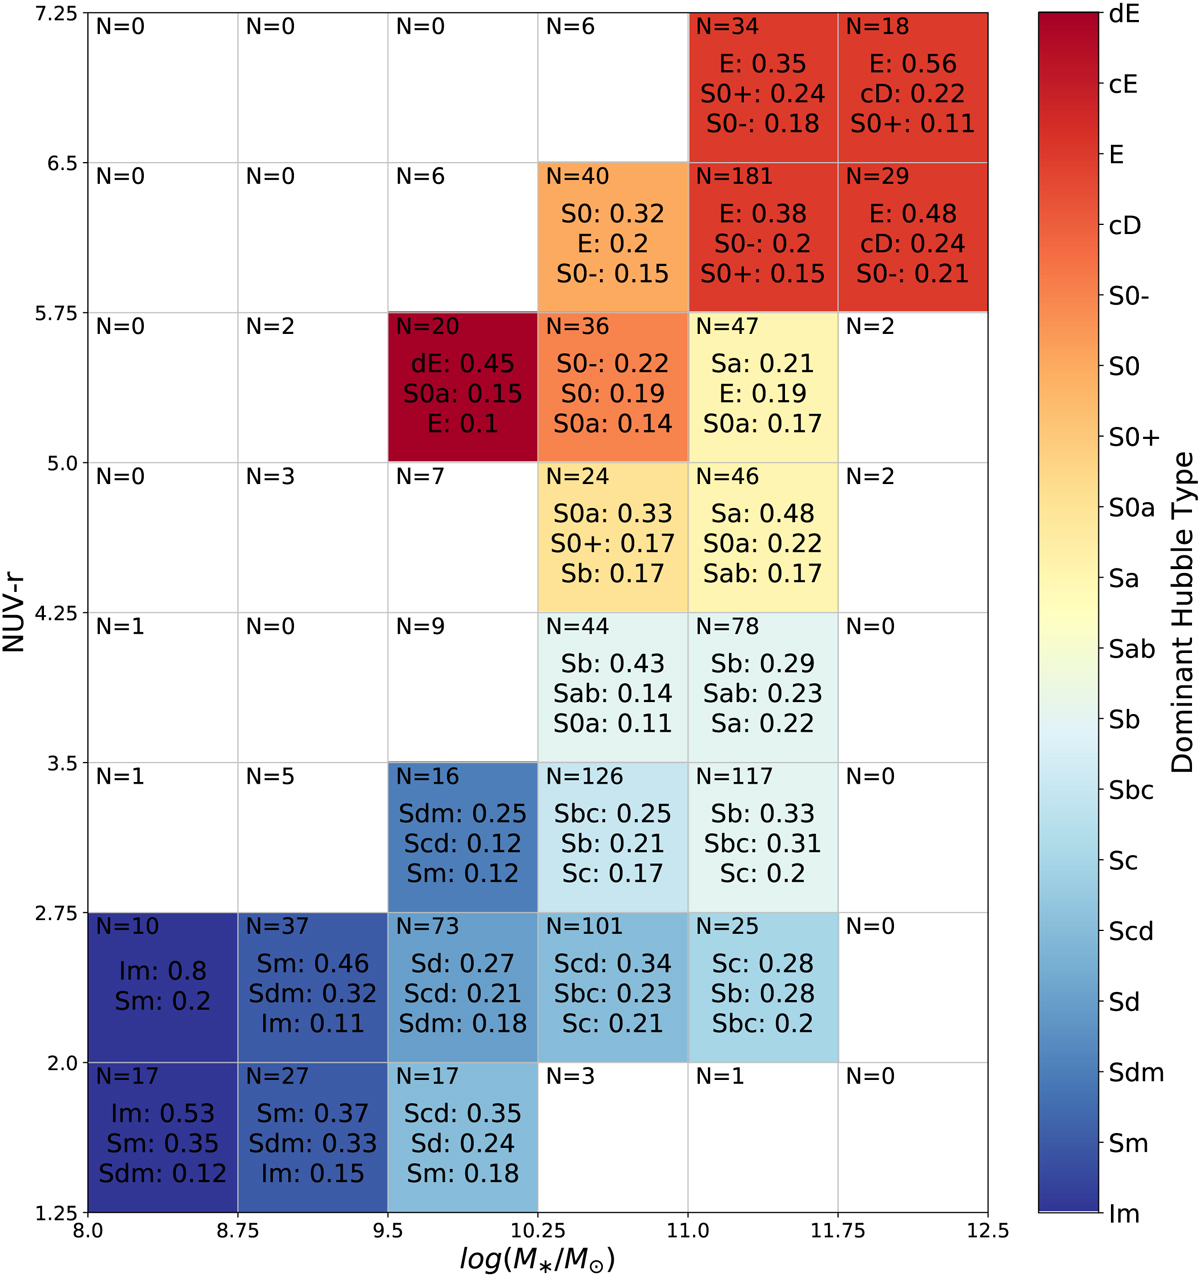
Fig. 20.
Download original image
Fractions of morphological types for EFIGI ∩ GALEX galaxies with Incl-Elong ≤ 2: the three most represented Hubble types are listed in color-mass cells of 0.75 dex in both color and mass. The associated error on the mean, and the number of galaxies in each cell are indicated. The color of the cells represents the most represented morphological type. Similarly to the effect seen in Fig. 13, the dominant Hubble type varies continuously along the color-mass diagram from the Im bluest and lowest mass galaxies to the blue and more massive spirals, through the massive and redder early-type spirals, and up to the red lenticulars and even more massive ellipticals.
Current usage metrics show cumulative count of Article Views (full-text article views including HTML views, PDF and ePub downloads, according to the available data) and Abstracts Views on Vision4Press platform.
Data correspond to usage on the plateform after 2015. The current usage metrics is available 48-96 hours after online publication and is updated daily on week days.
Initial download of the metrics may take a while.