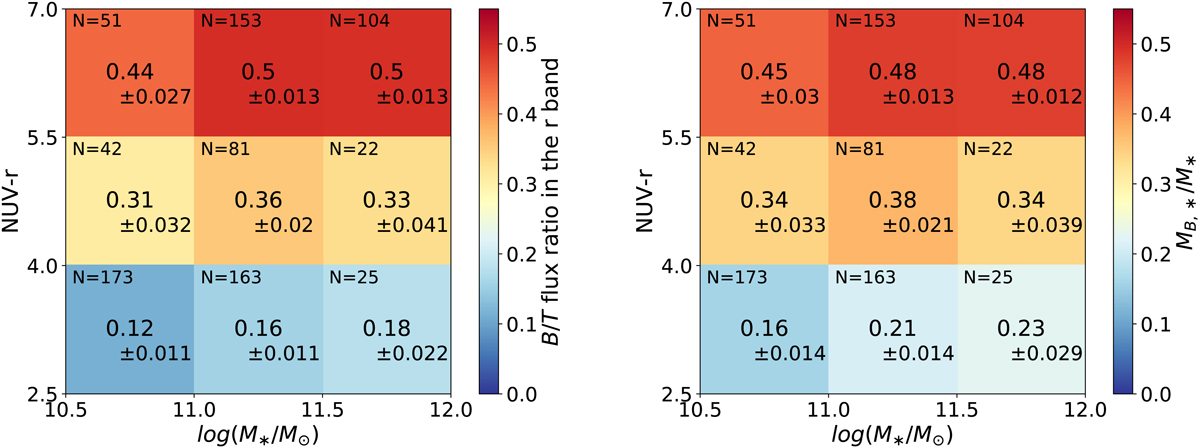
Fig. 17.
Download original image
Mean value of the bulge-to-total ratio for EFIGI ∩ GALEX galaxies with Incl-Elong ≤ 2 in color-mass cells of 0.5 dex in total stellar mass and 1.5 in NUV−r color, and derived from Fig. 16. Only the bright part of the Blue Cloud, the Green Plain and the Red Sequence are shown. The associated error on the mean, and the number of galaxies in each cell are indicated. Left: luminosity ratio in the r band, Right: stellar mass ratio. There is a significant increase in the bulge-to-total ratio in both luminosity and mass with the NUV−r color across the Green Plain, by a factor of ∼1.5 − 2.6 and ∼2.1 − 3.6 from the Blue Cloud to the Green Plain and the Red Sequence respectively. There is no effect with the galaxy stellar mass across the Green Plain, but a moderate one across the Red Sequence and sampled Blue Cloud.
Current usage metrics show cumulative count of Article Views (full-text article views including HTML views, PDF and ePub downloads, according to the available data) and Abstracts Views on Vision4Press platform.
Data correspond to usage on the plateform after 2015. The current usage metrics is available 48-96 hours after online publication and is updated daily on week days.
Initial download of the metrics may take a while.