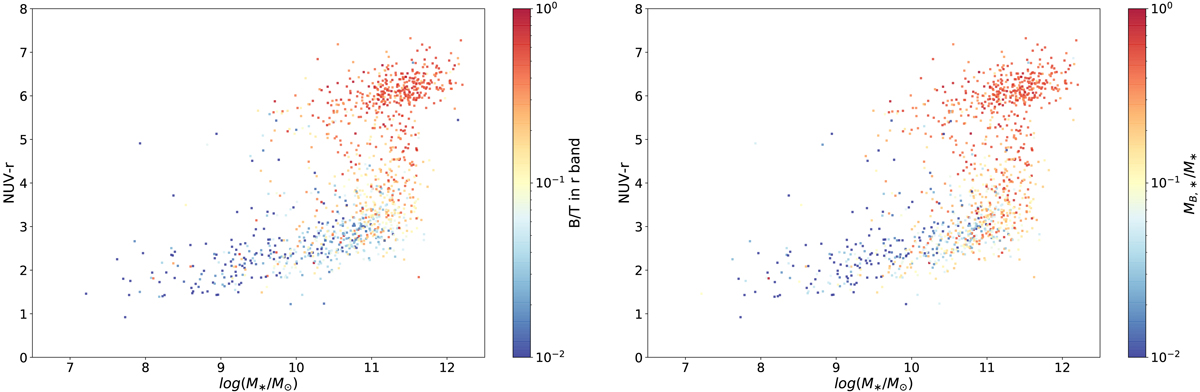
Fig. 16.
Download original image
Color-mass diagram for all EFIGI ∩ GALEX galaxies with Incl-Elong ≤ 2, in which the color of the points represents in the left panel, the bulge over total luminosity ratio (B/T) in the r band, and in the right panel, the bulge over total stellar mass ratio. Both graphs show the same trend of an increase from the tail of the Blue Cloud at the lowest stellar masses, to the Red Sequence.
Current usage metrics show cumulative count of Article Views (full-text article views including HTML views, PDF and ePub downloads, according to the available data) and Abstracts Views on Vision4Press platform.
Data correspond to usage on the plateform after 2015. The current usage metrics is available 48-96 hours after online publication and is updated daily on week days.
Initial download of the metrics may take a while.