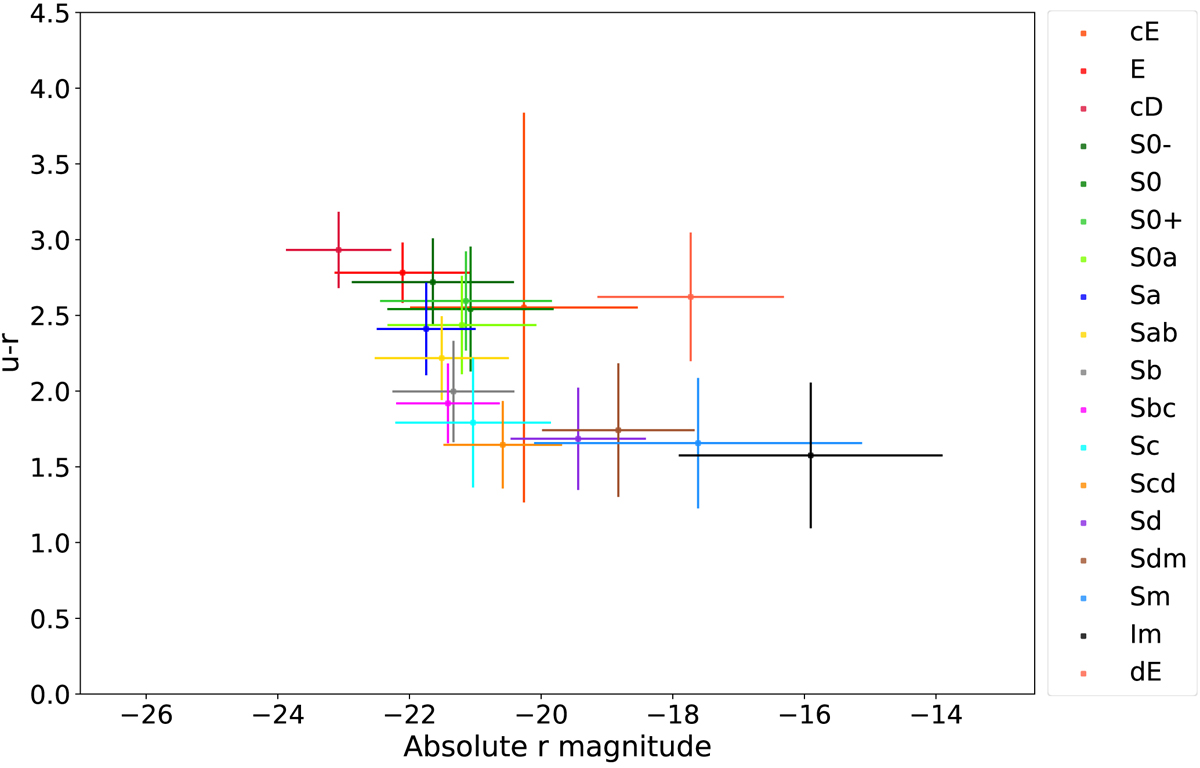
Fig. 10.
Download original image
Mean position of each Hubble type in the color-magnitude diagram, using the absolute u − r color for all EFIGI galaxies with Incl-Elong ≤ 2. One sees a similar “S” sequence as in NUV−r color (see Fig. 5), but without the additional spacing of S0+-S0a and Sa-Sab types that generates the Green Plain. The central point with very large error bars correspond to the rare cE types, whereas dE are located at ( − 17.8, 2.6), away from the “S” sequence.
Current usage metrics show cumulative count of Article Views (full-text article views including HTML views, PDF and ePub downloads, according to the available data) and Abstracts Views on Vision4Press platform.
Data correspond to usage on the plateform after 2015. The current usage metrics is available 48-96 hours after online publication and is updated daily on week days.
Initial download of the metrics may take a while.