Fig. 3
Download original image
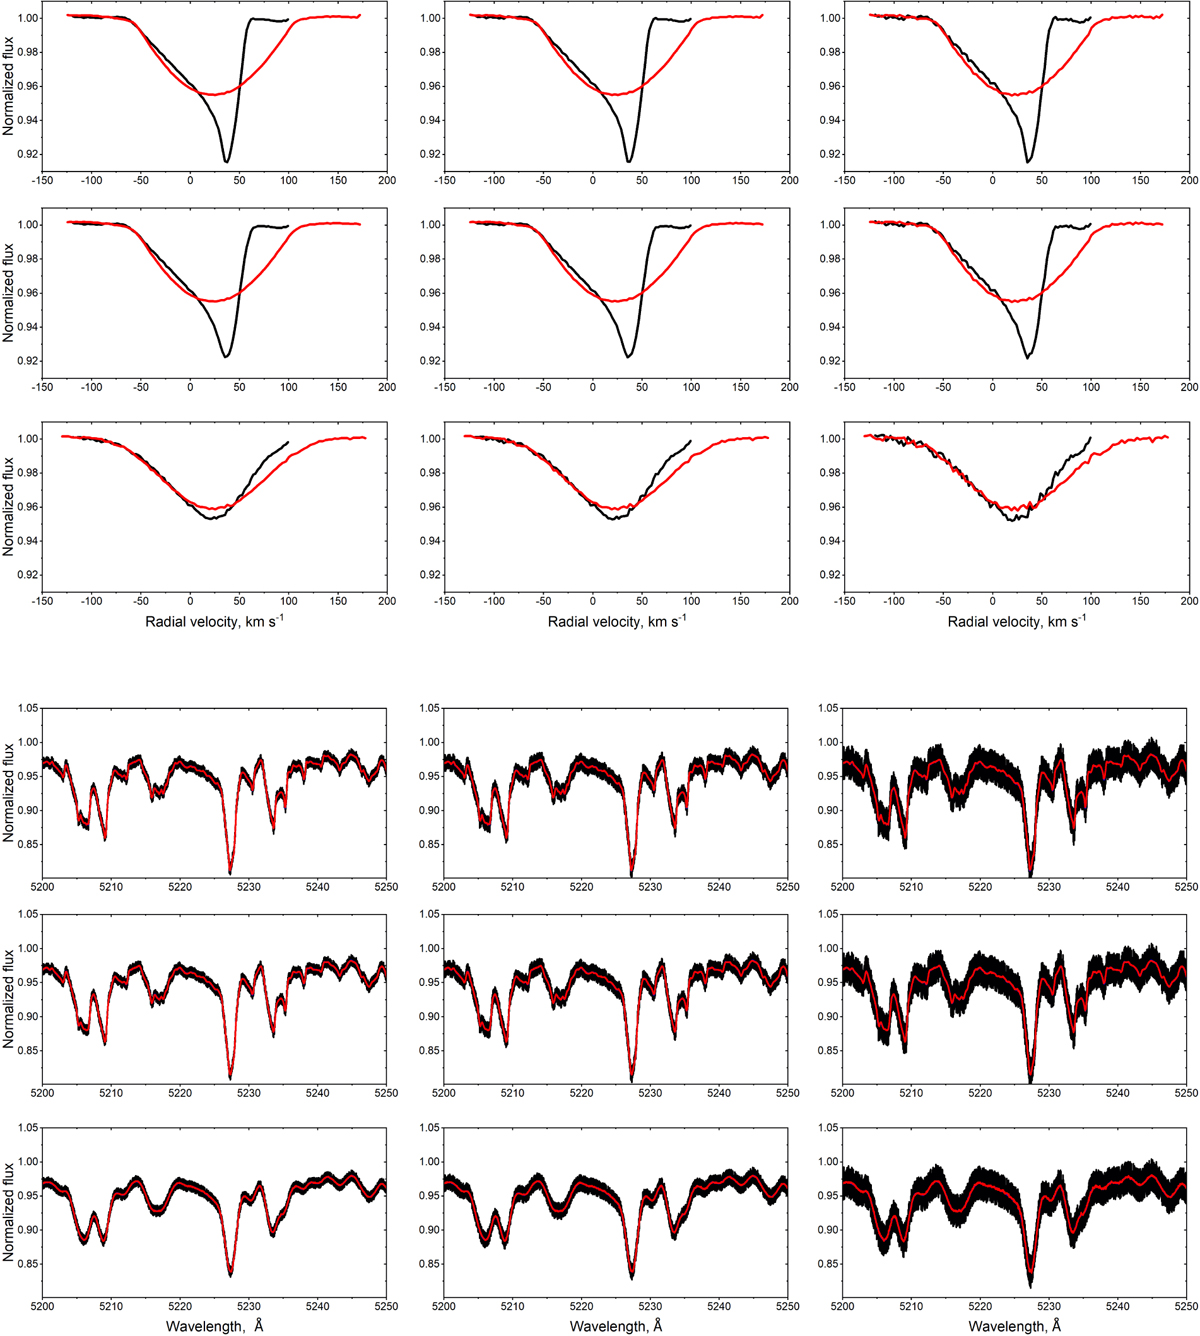
Results of the application of the LSDBinary algorithm to artificial in-eclipse spectra of the RZ Cas binary system. Top block: LSD profiles of the primary (red) and secondary (black) components. Bottom block: LSD-based model spectra (red) overlaid on the input ‘observed’ spectra (black) of the system. In each of the blocks, rows correspond to different values of the resolving power (from top to bottom, R = 60 000, 25 000, and 5000), while columns reflect the change in S/N of the spectrum (from left to right, S/N = 120, 80, and 40).
Current usage metrics show cumulative count of Article Views (full-text article views including HTML views, PDF and ePub downloads, according to the available data) and Abstracts Views on Vision4Press platform.
Data correspond to usage on the plateform after 2015. The current usage metrics is available 48-96 hours after online publication and is updated daily on week days.
Initial download of the metrics may take a while.