Fig. 2
Download original image
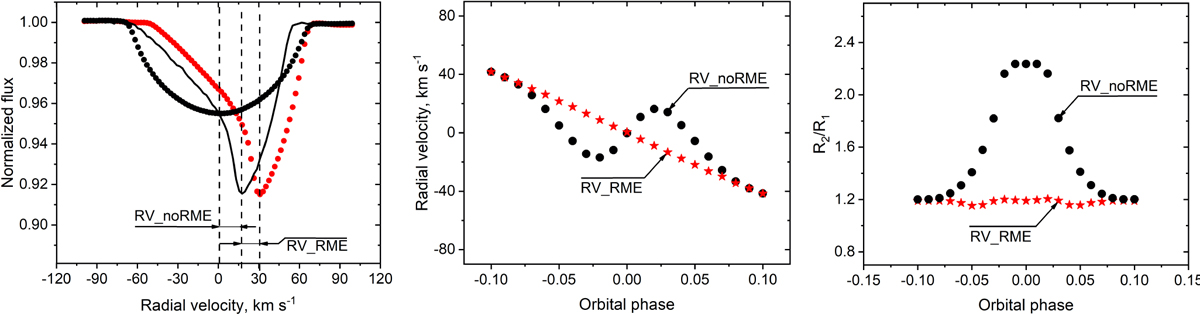
Graphical presentation of the LSDBinary algorithm. Left: initial guess synthetic LSD profiles computed with the LSDinit module, with (red stars) and without (black dots) the RM effect, along with the resulting ‘observed’ LSD profile (solid black line) computed with the LSDBinary module. Middle: in-eclipse phase-resolved RV curves, with (red stars) and without (black dots) the RM effect taken into account in the computation of the initial guess LSD profiles. The RVs measured relative to the respective initial guess LSD profiles are indicated with the arrows. Right: radii ratio as a function of orbital phase, with (red stars) and without (black dots) the RM effect taken into account in the computation of the initial guess synthetic spectrum-based LSD profiles. Arrows indicate the same data points as in the middle panel. See text for details.
Current usage metrics show cumulative count of Article Views (full-text article views including HTML views, PDF and ePub downloads, according to the available data) and Abstracts Views on Vision4Press platform.
Data correspond to usage on the plateform after 2015. The current usage metrics is available 48-96 hours after online publication and is updated daily on week days.
Initial download of the metrics may take a while.