Fig. 1
Download original image
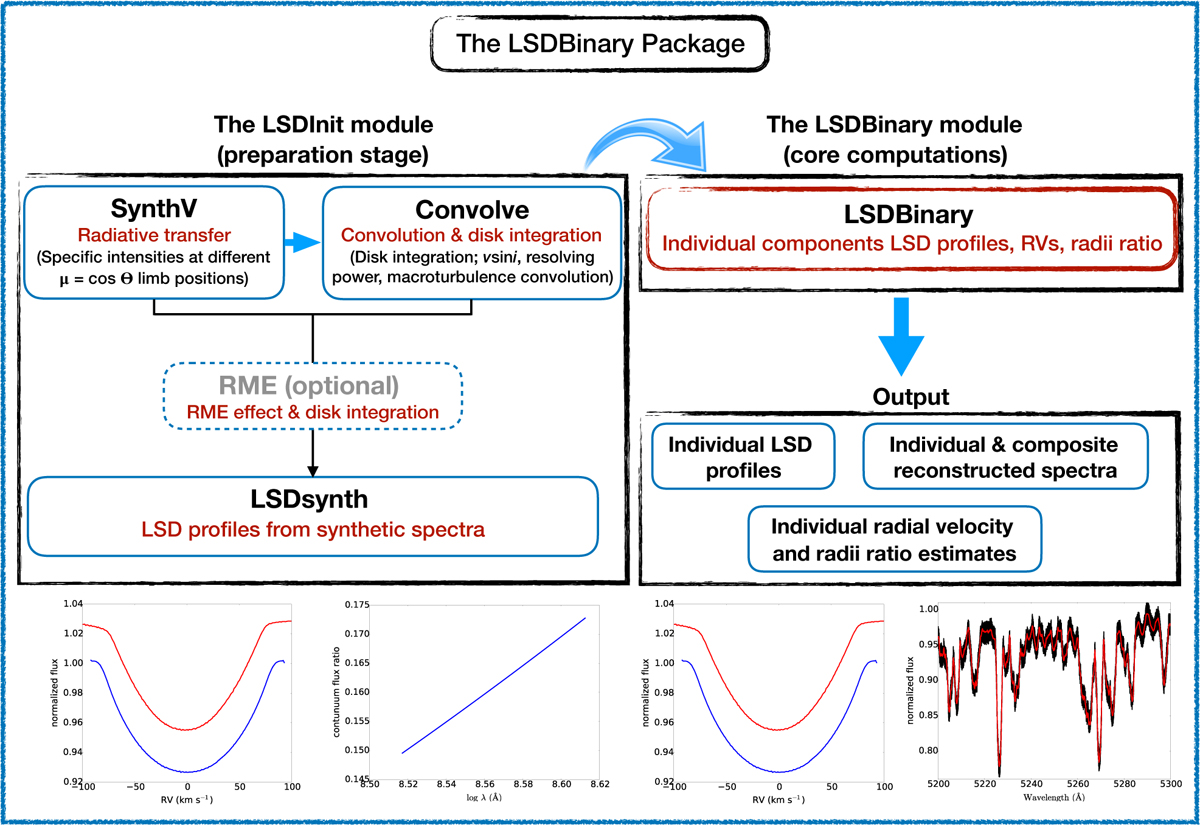
LSDBinary algorithm flow chart. Bottom left panels show output of the LSDinit programme in terms of the LSD profiles computed from synthetic spectra (left) and the continuum flux ratio of the two binary components as a function of the wavelength (right). The output of the LSDBinary programme is illustrated in the two bottom right panels, showing LSD profiles of the individual binary components (left) and a comparison between the composite observed (black) and LSD-based model (red) spectra of the binary. See Sect. 3 for details.
Current usage metrics show cumulative count of Article Views (full-text article views including HTML views, PDF and ePub downloads, according to the available data) and Abstracts Views on Vision4Press platform.
Data correspond to usage on the plateform after 2015. The current usage metrics is available 48-96 hours after online publication and is updated daily on week days.
Initial download of the metrics may take a while.