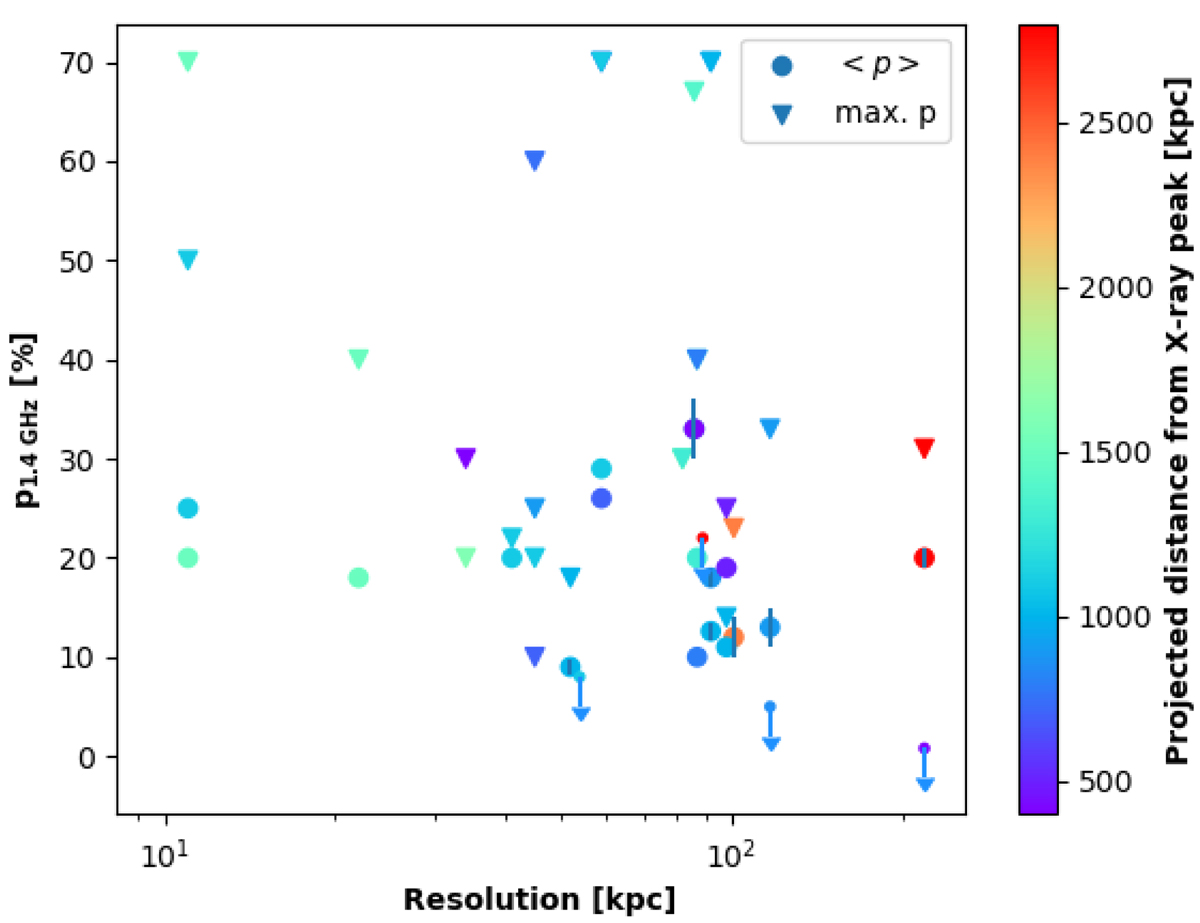
Fig. 11.
Download original image
Fractional polarization versus physical resolution of the observation for double radio relics. Each marker represents a single relic. Circles are average fractional polarization computed integrating over the polarized regions of the relic, downward triangles are the maximum values (therefore one relic can have both measurements in the plot). Arrows are upper limits computed for relics where we did not detect polarization. The color-scale represents the projected distance of the relic from the X-ray peak of the hosting galaxy cluster.
Current usage metrics show cumulative count of Article Views (full-text article views including HTML views, PDF and ePub downloads, according to the available data) and Abstracts Views on Vision4Press platform.
Data correspond to usage on the plateform after 2015. The current usage metrics is available 48-96 hours after online publication and is updated daily on week days.
Initial download of the metrics may take a while.