Fig. 7.
Download original image
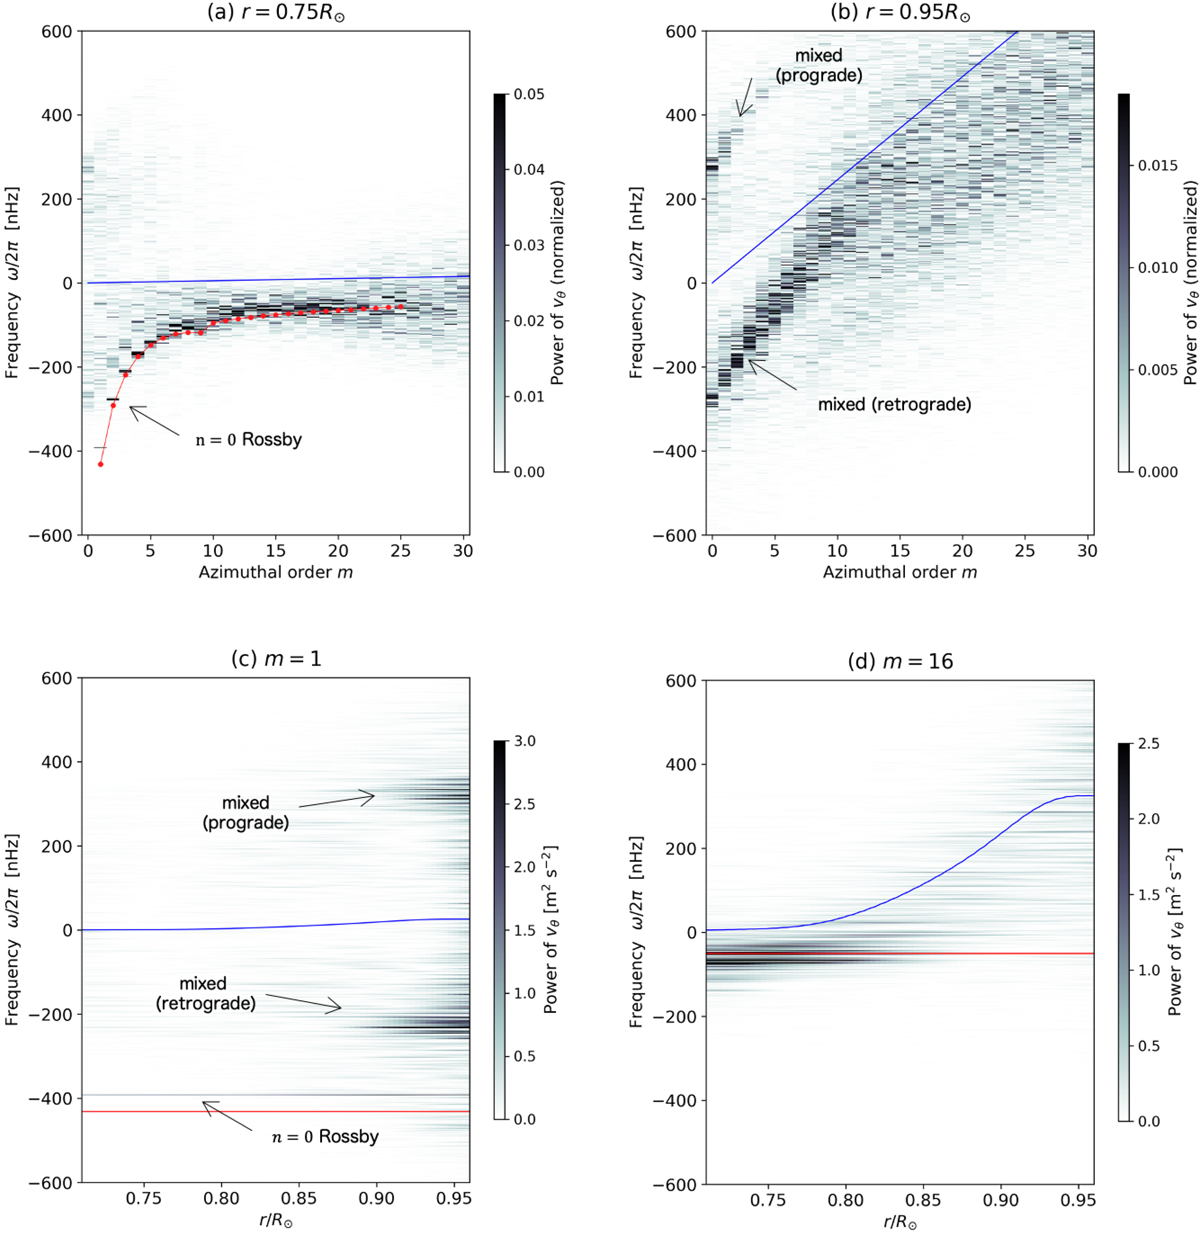
Power spectra of latitudinal velocity vθ near the equator (averaged over ±15 deg). Panels a and b: m − ω diagram near the base (r = 0.75 R⊙) and near the surface (r = 0.95 R⊙), respectively. The power is normalized at each m. The spectra are computed in a frame rotating at Ω0/2π = 431.3 nHz. Overplotted in red line in panel a is the dispersion relation of the equatorial Rossby mode with no radial node (n = 0) obtained from the linear calculation. The blue line represents the advection frequency of the equatorial differential rotation, m[Ω(r,π/2)−Ω0], at each height. Panels c and d: power spectra at fixed azimuthal order m = 1 and m = 16, respectively.
Current usage metrics show cumulative count of Article Views (full-text article views including HTML views, PDF and ePub downloads, according to the available data) and Abstracts Views on Vision4Press platform.
Data correspond to usage on the plateform after 2015. The current usage metrics is available 48-96 hours after online publication and is updated daily on week days.
Initial download of the metrics may take a while.