Fig. 4.
Download original image
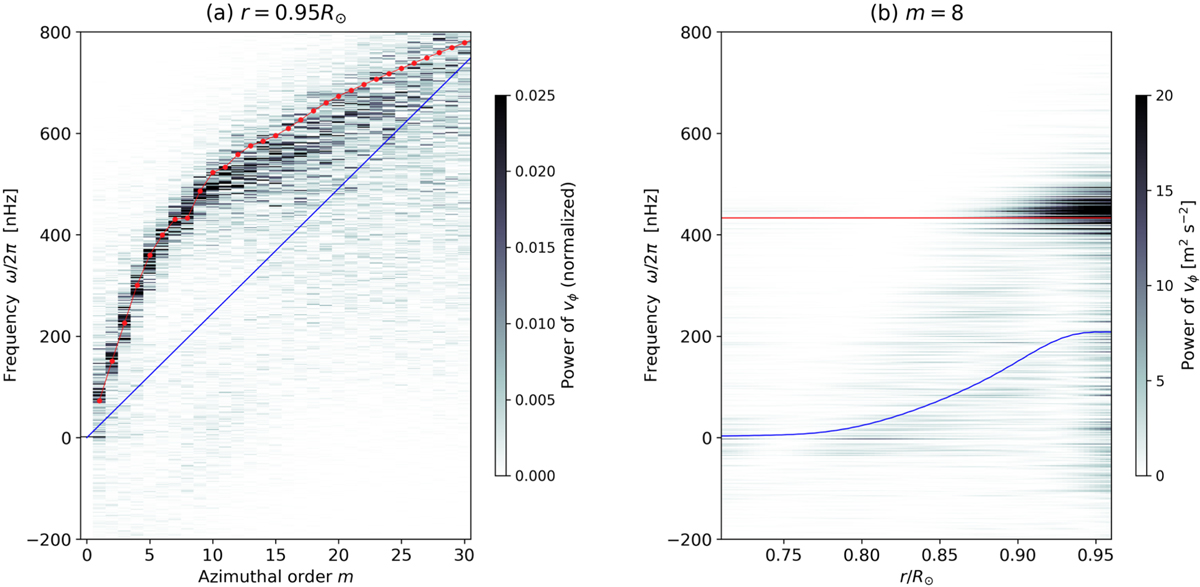
Equatorial power spectra of longitudinal velocity vϕ. (a) The power spectrum near the top boundary r = 0.95 R⊙. The power is normalized at each m. The spectrum is computed in a frame rotating at Ω0/2π = 431.3 nHz (the rotation rate of the radiative interior). The blue line represents the advective speed by the local differential rotation, m[Ω(0.95R⊙,π/2)−Ω0]. Overplotted in red is the dispersion relation of the columnar convective modes from the linear eigenmode calculation. (b) Same equatorial power spectrum as in (a), but at fixed azimuthal order m = 8 as a function of depth. The blue line is again the local advection frequency and the red line is the eigenfrequency from the linear analysis.
Current usage metrics show cumulative count of Article Views (full-text article views including HTML views, PDF and ePub downloads, according to the available data) and Abstracts Views on Vision4Press platform.
Data correspond to usage on the plateform after 2015. The current usage metrics is available 48-96 hours after online publication and is updated daily on week days.
Initial download of the metrics may take a while.