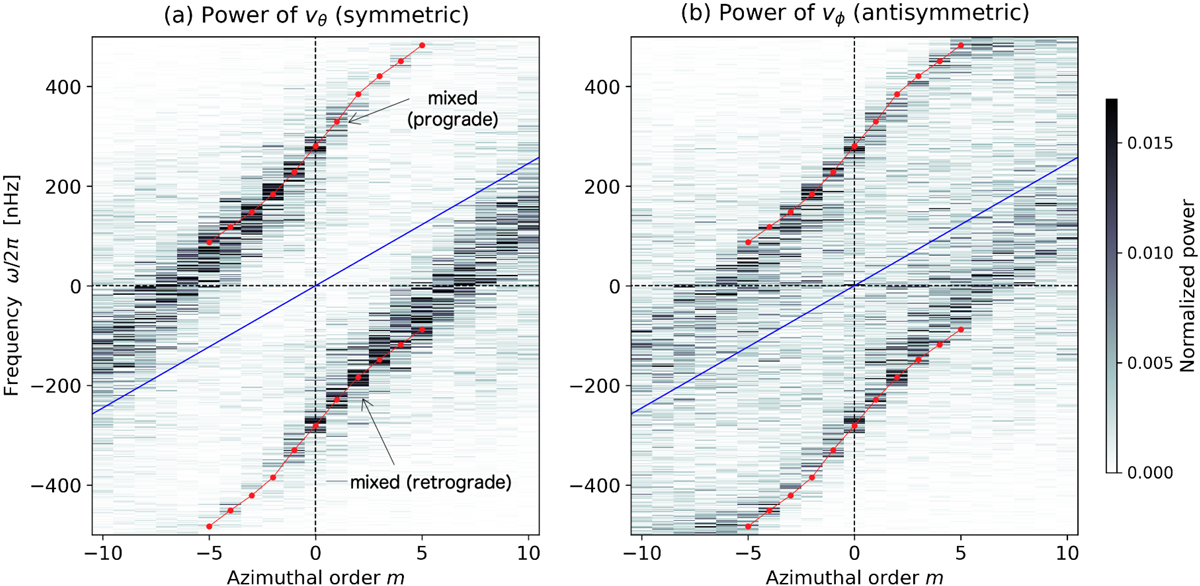
Fig. 12.
Download original image
Power spectra of horizontal velocities near the surface extended to negative azimuthal orders (m < 0). (a) Equatorial power spectrum of north-south symmetric component of vθ near the top boundary r = 0.95 R⊙, which is the same as Fig. 7b. The power is normalized at each m. Shown in red points are the frequencies of the mixed Rossby modes obtained from our linear analysis. The blue line represents the advection frequency of the equatorial differential rotation, m[Ω(0.95 R⊙,π/2)−Ω0]. (b) Equatorial power spectrum of north-south antisymmetric component of vϕ near the top boundary r = 0.95 R⊙.
Current usage metrics show cumulative count of Article Views (full-text article views including HTML views, PDF and ePub downloads, according to the available data) and Abstracts Views on Vision4Press platform.
Data correspond to usage on the plateform after 2015. The current usage metrics is available 48-96 hours after online publication and is updated daily on week days.
Initial download of the metrics may take a while.