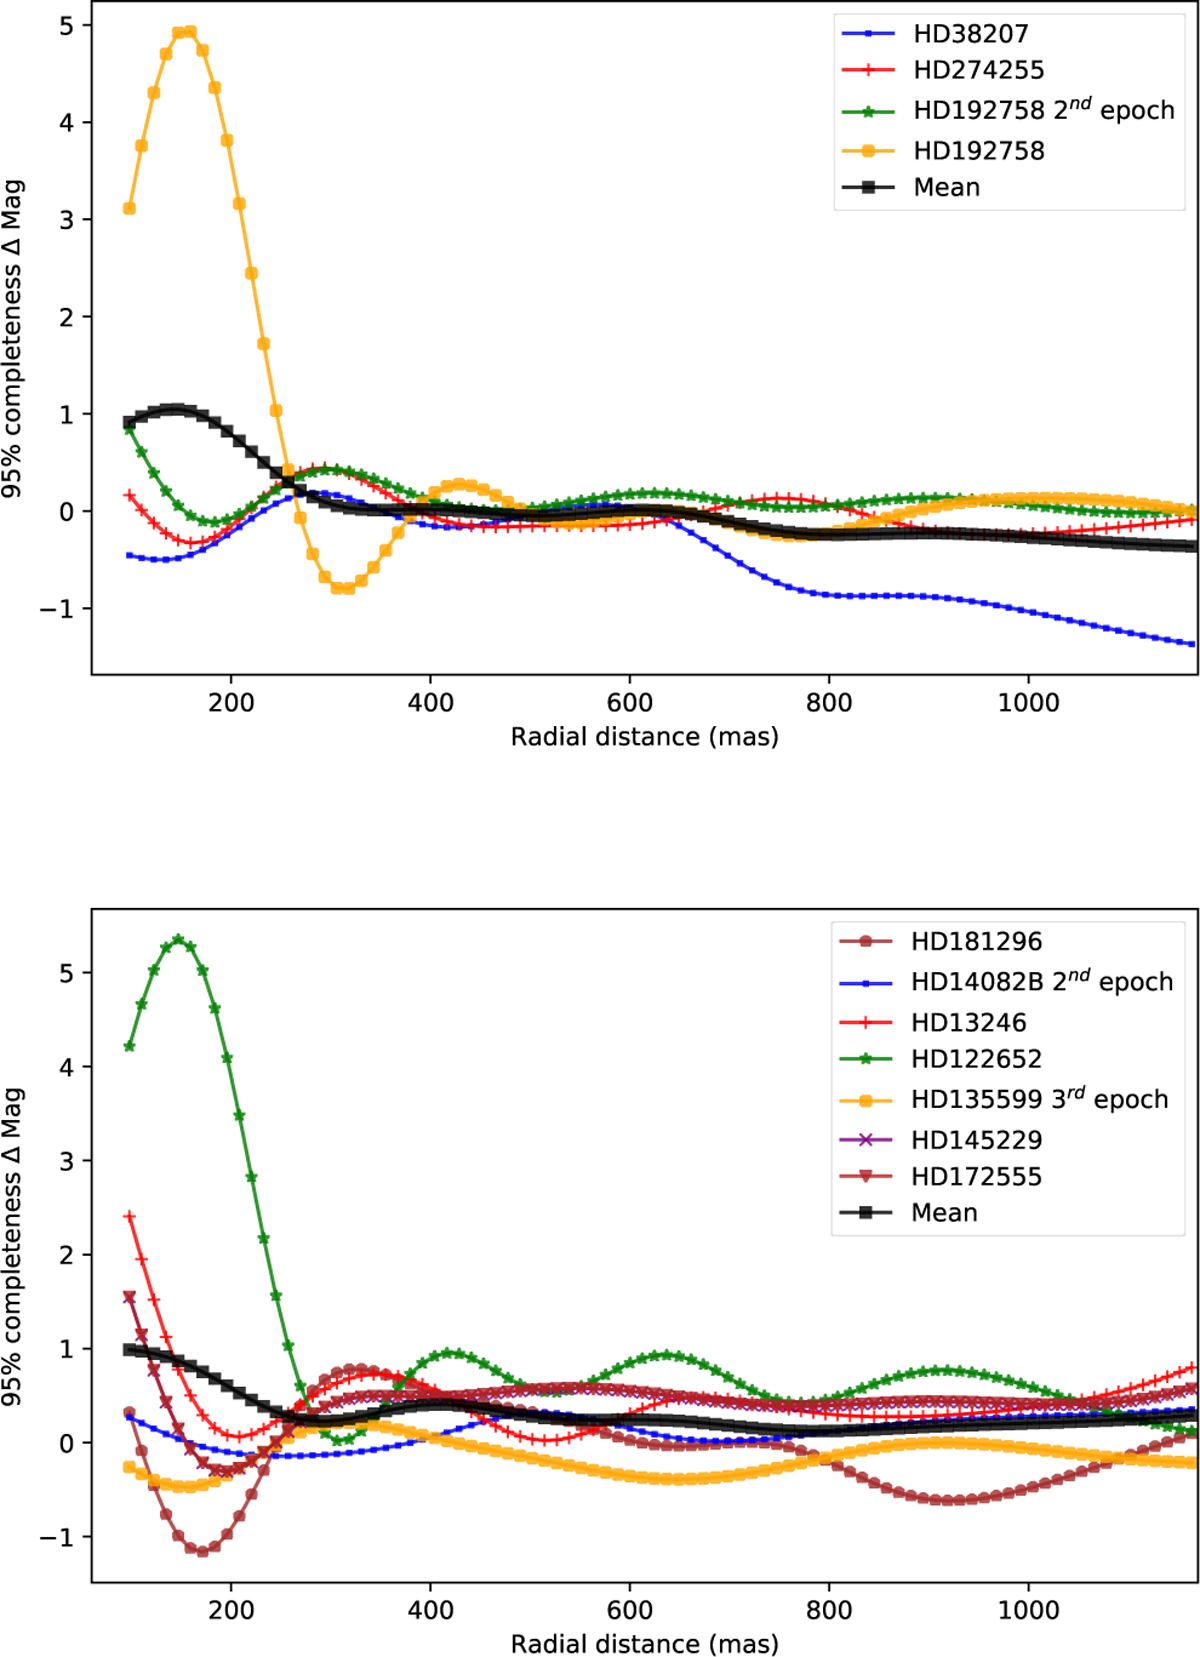
Fig. 9
Download original image
Angular evolution of the contrast difference, for the cluster 1-1 (top) and 2-3 (bottom), between the contrast obtained with their optimal parametrisation (corresponding to the optimal parametrisation of their respective cluster center, HD 192758 and HD 181296) and the contrast obtained with the optimal parametrisation of another cluster center (resp. HD 3670 and HD 3003, i.e. the center of the cluster 1-2 and 24), expressed in terms of ∆ mag. A positive ∆ mag indicates a poorer contrast achieved with the optimal parametrisation of the other cluster centres compared to their own cluster center. The black curve provide the ∆ mag averaged over the set of considered targets.
Current usage metrics show cumulative count of Article Views (full-text article views including HTML views, PDF and ePub downloads, according to the available data) and Abstracts Views on Vision4Press platform.
Data correspond to usage on the plateform after 2015. The current usage metrics is available 48-96 hours after online publication and is updated daily on week days.
Initial download of the metrics may take a while.