Fig. D.1
Download original image
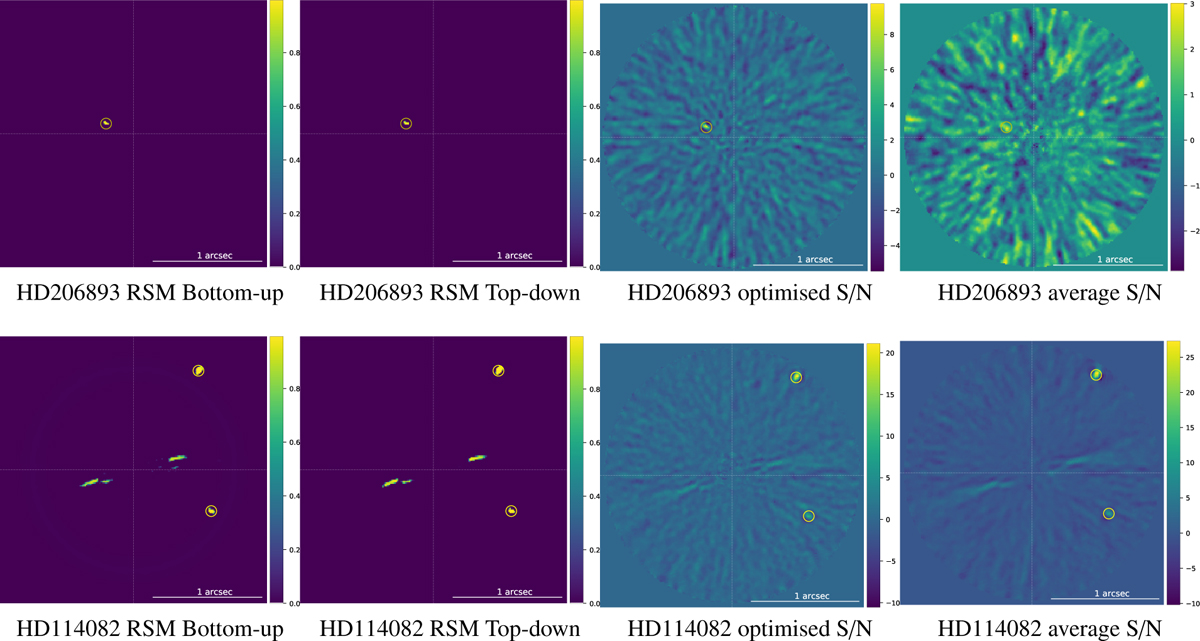
RSM detection maps generated using the Auto-RSM with the bottom-up (left) and top-down (middle left) approaches to select the optimal set of likelihoods cubes (each likelihood cube corresponds to a PSF-subtraction technique), S/N maps generated using the Auto-SNR to select the optimal set of S/N maps (middle right) and S/N maps obtained by averaging the S/N map generated with APCA, NMF, LLSG, and LOCI (right). The expected position of the planetary signal as estimated via the RSM based planetary signal characterisation algorithm is indicated by a yellow circle.
Current usage metrics show cumulative count of Article Views (full-text article views including HTML views, PDF and ePub downloads, according to the available data) and Abstracts Views on Vision4Press platform.
Data correspond to usage on the plateform after 2015. The current usage metrics is available 48-96 hours after online publication and is updated daily on week days.
Initial download of the metrics may take a while.