Fig. 2
Download original image
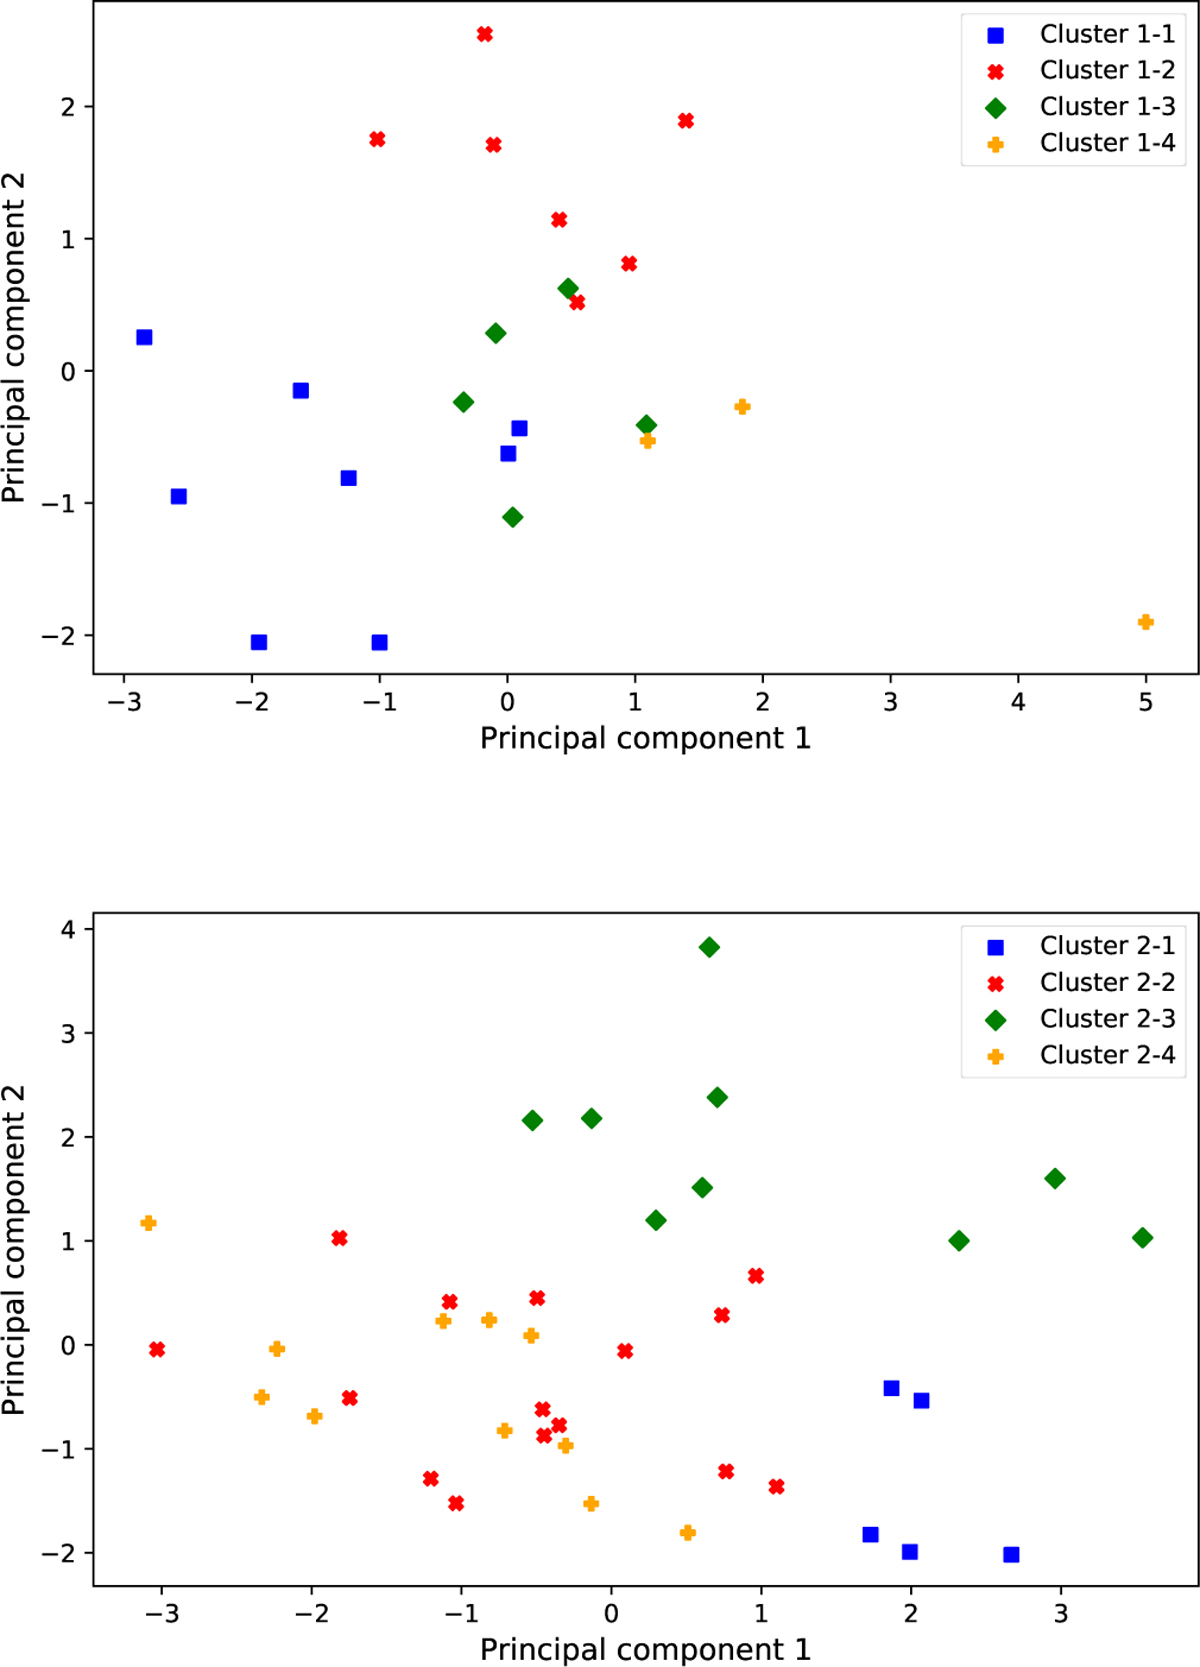
Projection of the SHARDDS survey targets on the first two principal components computed based on their observational characteristics. The top (respectively bottom) graph provides the targets with a number of frames in their ADI sequence below 151 (respectively above 151). The colours indicates to which cluster the target has been assigned.
Current usage metrics show cumulative count of Article Views (full-text article views including HTML views, PDF and ePub downloads, according to the available data) and Abstracts Views on Vision4Press platform.
Data correspond to usage on the plateform after 2015. The current usage metrics is available 48-96 hours after online publication and is updated daily on week days.
Initial download of the metrics may take a while.