Fig. 5
Download original image
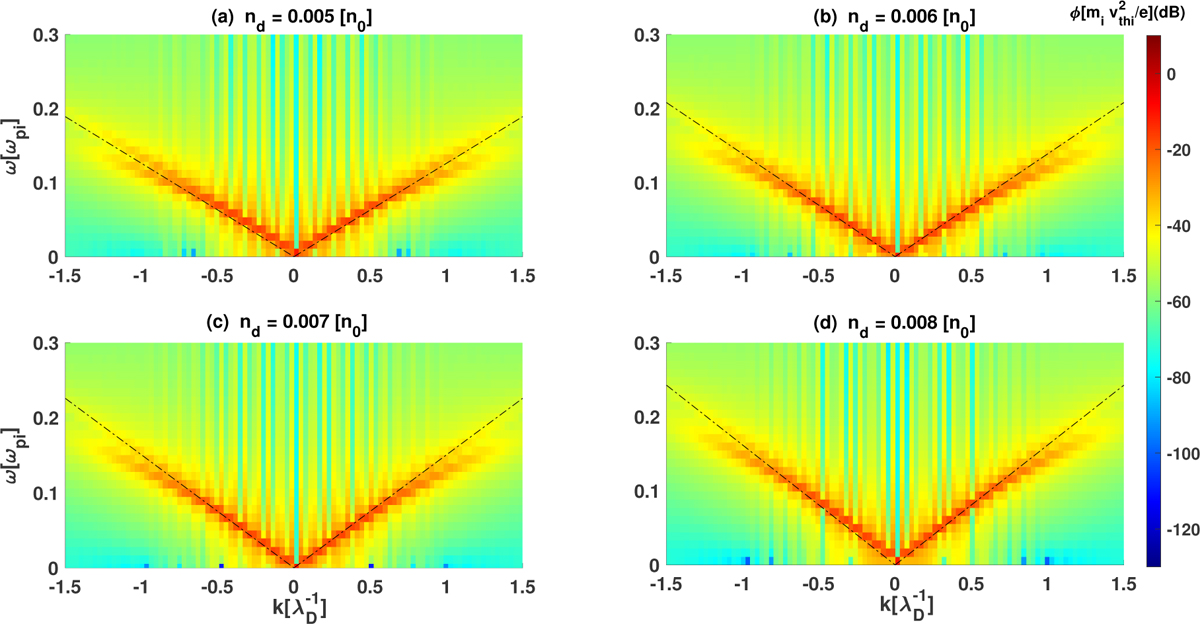
Frequency-wavenumber (ω–k) diagram for different values of the dust density (nd) based on data from runs 1(ii–v). The dashed black lines are plotted from the linear dispersion of DA waves in each case, based on Eq. (10). The depicted ω–k plots were generated by using data in the time interval ωpit = 0–640. The phase speeds of DASWs obtained as 0.13, 0.14, 0.15 and 0.16 [Vthi] when nd is 0.005, 0.006, 0.007, and 0.008, respectively.
Current usage metrics show cumulative count of Article Views (full-text article views including HTML views, PDF and ePub downloads, according to the available data) and Abstracts Views on Vision4Press platform.
Data correspond to usage on the plateform after 2015. The current usage metrics is available 48-96 hours after online publication and is updated daily on week days.
Initial download of the metrics may take a while.