Fig. 5
Download original image
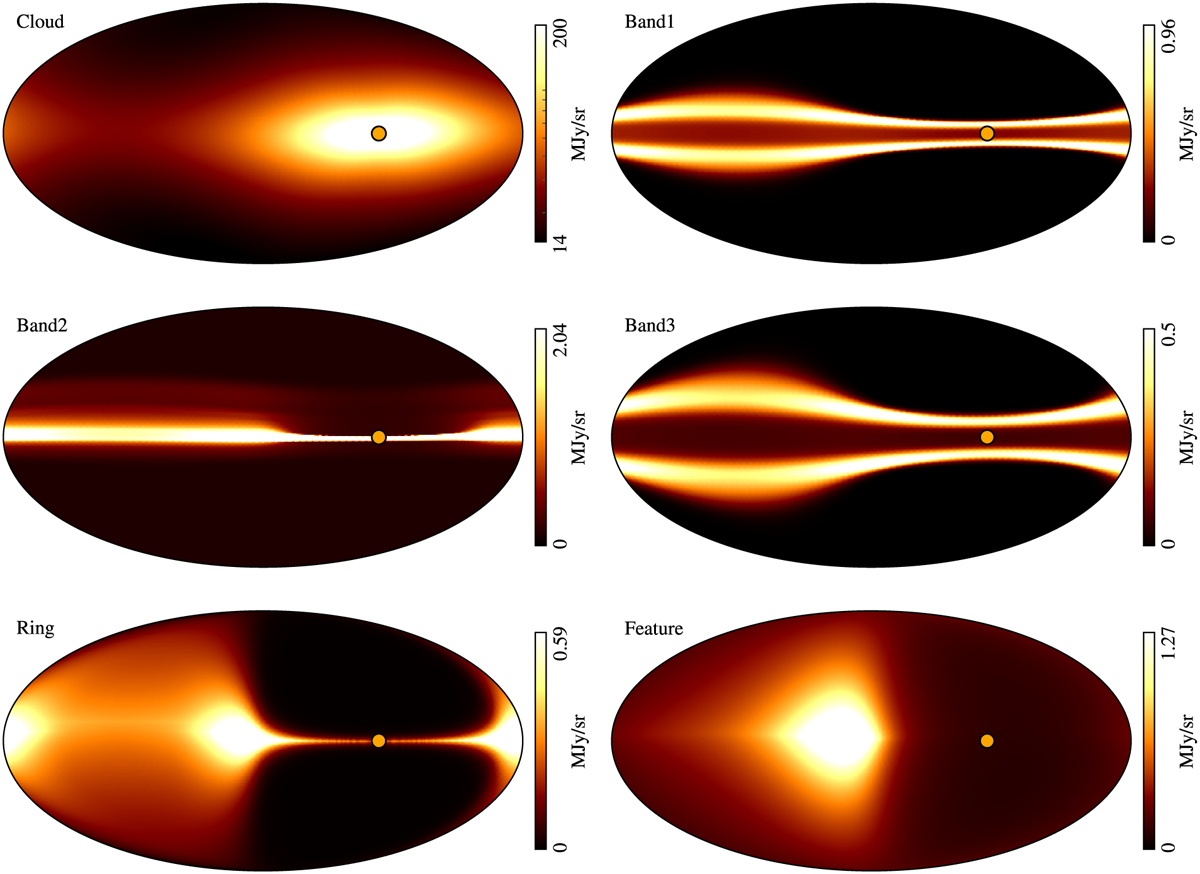
Instantaneous emission maps (January 1, 2020) for each IPD component in the DIRBE model. The Sun’s location is marked with an orange circle. Top left: the diffuse cloud. We note that the intensity is logarithmic due to the highly exponential nature of the zodiacal cloud density near the Sun. Top right: dust band 1. Middle left: dust band 2. Middle right: dust band 3. Bottom left: the circumsolar ring. Bottom right: the Earth-trailing feature.
Current usage metrics show cumulative count of Article Views (full-text article views including HTML views, PDF and ePub downloads, according to the available data) and Abstracts Views on Vision4Press platform.
Data correspond to usage on the plateform after 2015. The current usage metrics is available 48-96 hours after online publication and is updated daily on week days.
Initial download of the metrics may take a while.