Fig. 3.
Download original image
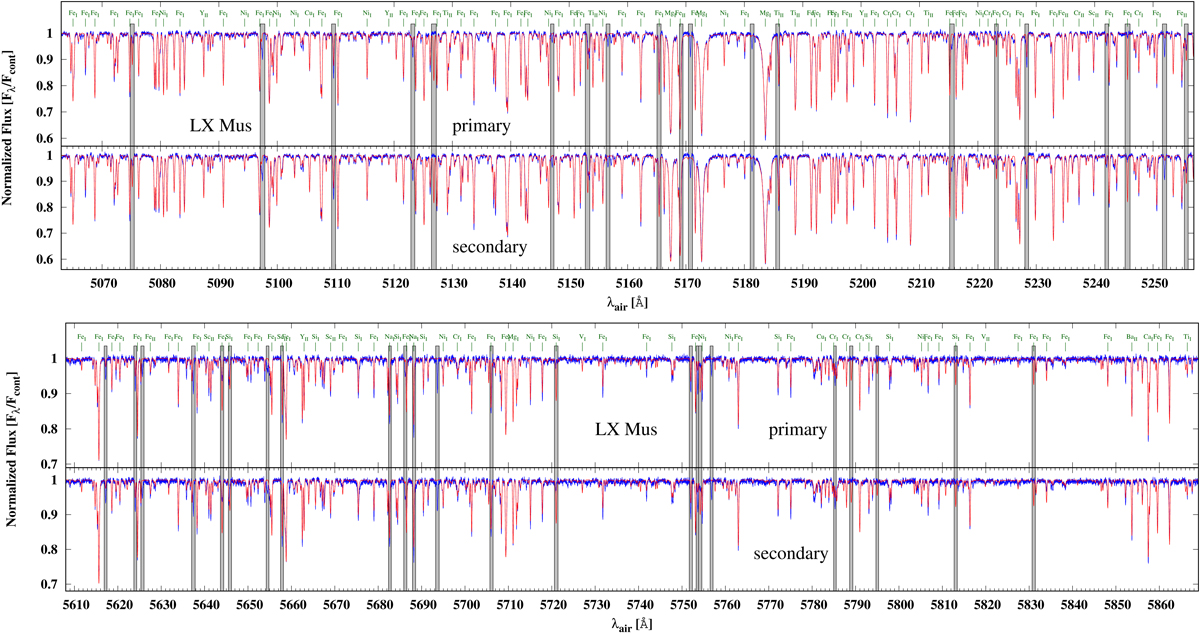
5063−5257 Å (top) and 5608−5869 Å (bottom) regions of uncorrected disentangled spectra of the primary and the secondary components of LX Mus with selected spectral lines identified. The red lines denote the atmosphere model fits to the observed spectra (blue). The grey-shaded areas were excluded from calculations by the use of an individual mask.
Current usage metrics show cumulative count of Article Views (full-text article views including HTML views, PDF and ePub downloads, according to the available data) and Abstracts Views on Vision4Press platform.
Data correspond to usage on the plateform after 2015. The current usage metrics is available 48-96 hours after online publication and is updated daily on week days.
Initial download of the metrics may take a while.