Open Access
Fig. 1.
Download original image
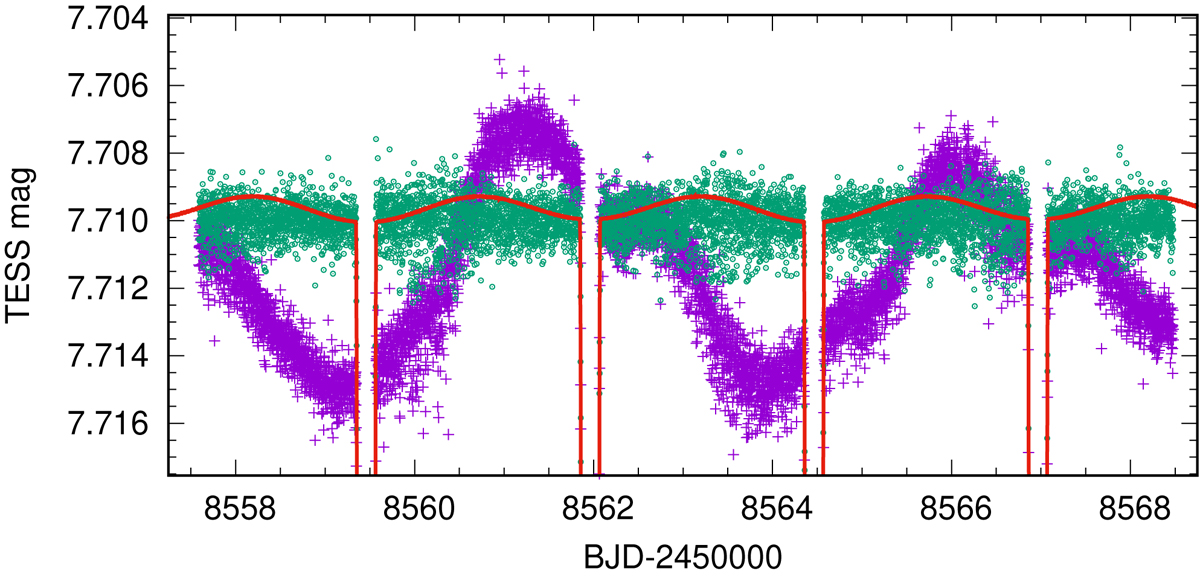
Illustration of the detrending process for the TESS sector 9 data of QR Hya. The violet crosses show the original data, and the green circles show the detrended data. The red line is a model light curve showing the size of the out-of-eclipse proximity effects.
Current usage metrics show cumulative count of Article Views (full-text article views including HTML views, PDF and ePub downloads, according to the available data) and Abstracts Views on Vision4Press platform.
Data correspond to usage on the plateform after 2015. The current usage metrics is available 48-96 hours after online publication and is updated daily on week days.
Initial download of the metrics may take a while.