Fig. 9
Download original image
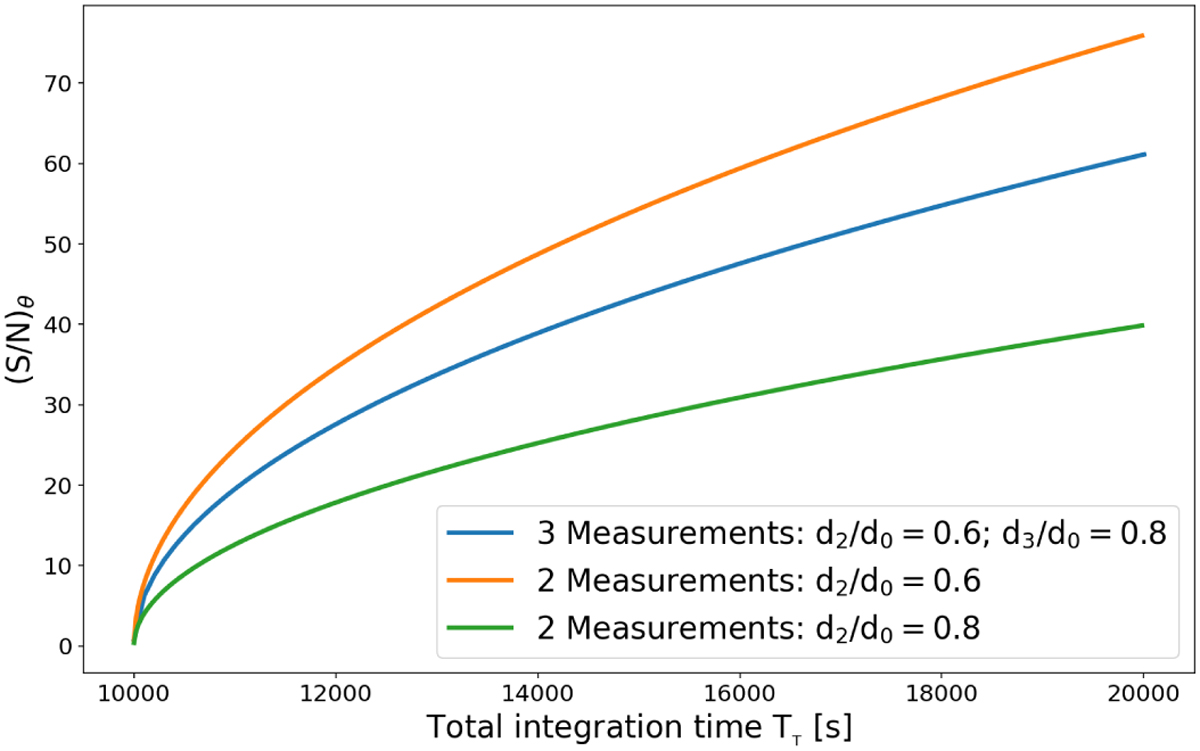
Trend of (S/N)θ as a function of the total integration time TT (the sum of the integration times of the measurements). The integration time for the first measurement is kept fixed to 10 ks. In this way, we compare results with the same total integration time (for the three-measurement scenario, the integration time TT − T1 is split equally into the two remaining measurements). The blue curve correspond to the case in which we measure three measurements with baselines 0.0, 0.6, and 0.8. The orange curve correspond to the case in which we measure two points with baselines 0.0 and 0.6. The green curve correspond to the case in which we measure two points with baselines 0.0 and 0.8.
Current usage metrics show cumulative count of Article Views (full-text article views including HTML views, PDF and ePub downloads, according to the available data) and Abstracts Views on Vision4Press platform.
Data correspond to usage on the plateform after 2015. The current usage metrics is available 48-96 hours after online publication and is updated daily on week days.
Initial download of the metrics may take a while.