Fig. 6
Download original image
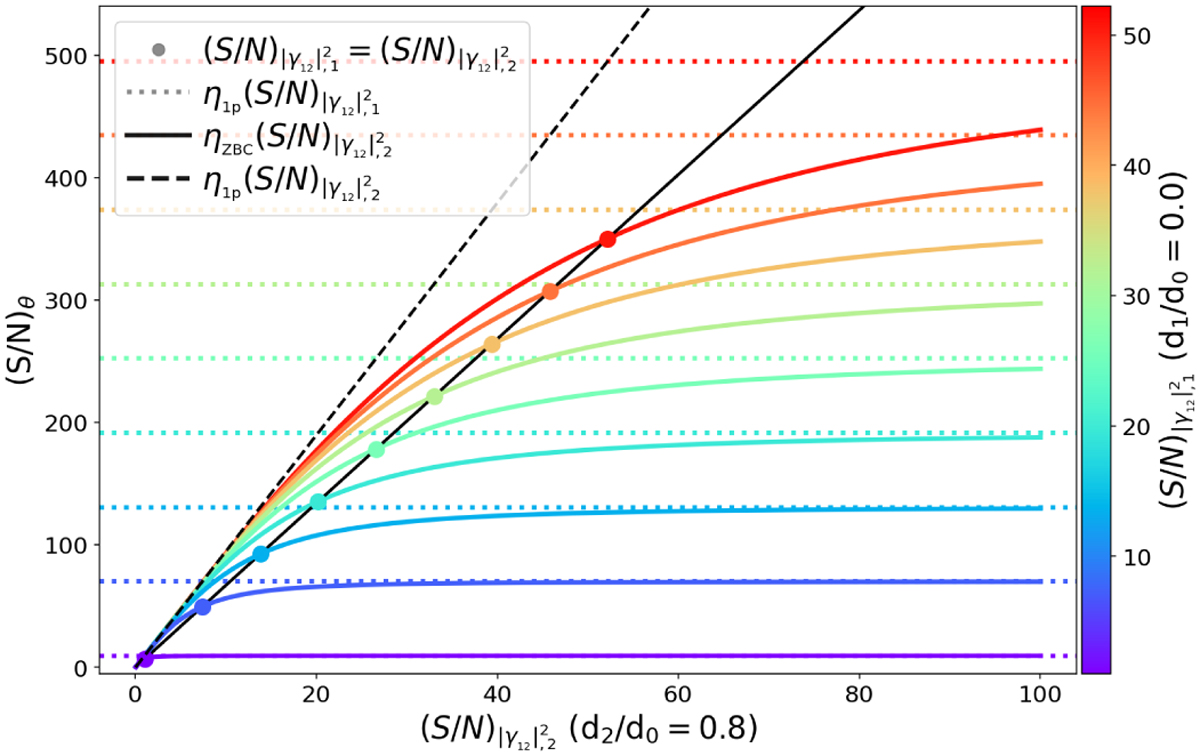
Trend of (S/N)θ as a function of ![]() . The baselines of the first and second measurements are fixed to 0.0 and 0.8. The solid coloured curves correspond to different values of
. The baselines of the first and second measurements are fixed to 0.0 and 0.8. The solid coloured curves correspond to different values of ![]() . The black line shows the trend in case of equal S/N for the two measurements, the dashed black line the trend for the single measurement scenario (Sect. 3), and the horizontal dotted lines represent the maximum limit of each of the corresponding coloured curves. The scenario in which we fix the second measurement is not shown because it is completely symmetric.
. The black line shows the trend in case of equal S/N for the two measurements, the dashed black line the trend for the single measurement scenario (Sect. 3), and the horizontal dotted lines represent the maximum limit of each of the corresponding coloured curves. The scenario in which we fix the second measurement is not shown because it is completely symmetric.
Current usage metrics show cumulative count of Article Views (full-text article views including HTML views, PDF and ePub downloads, according to the available data) and Abstracts Views on Vision4Press platform.
Data correspond to usage on the plateform after 2015. The current usage metrics is available 48-96 hours after online publication and is updated daily on week days.
Initial download of the metrics may take a while.