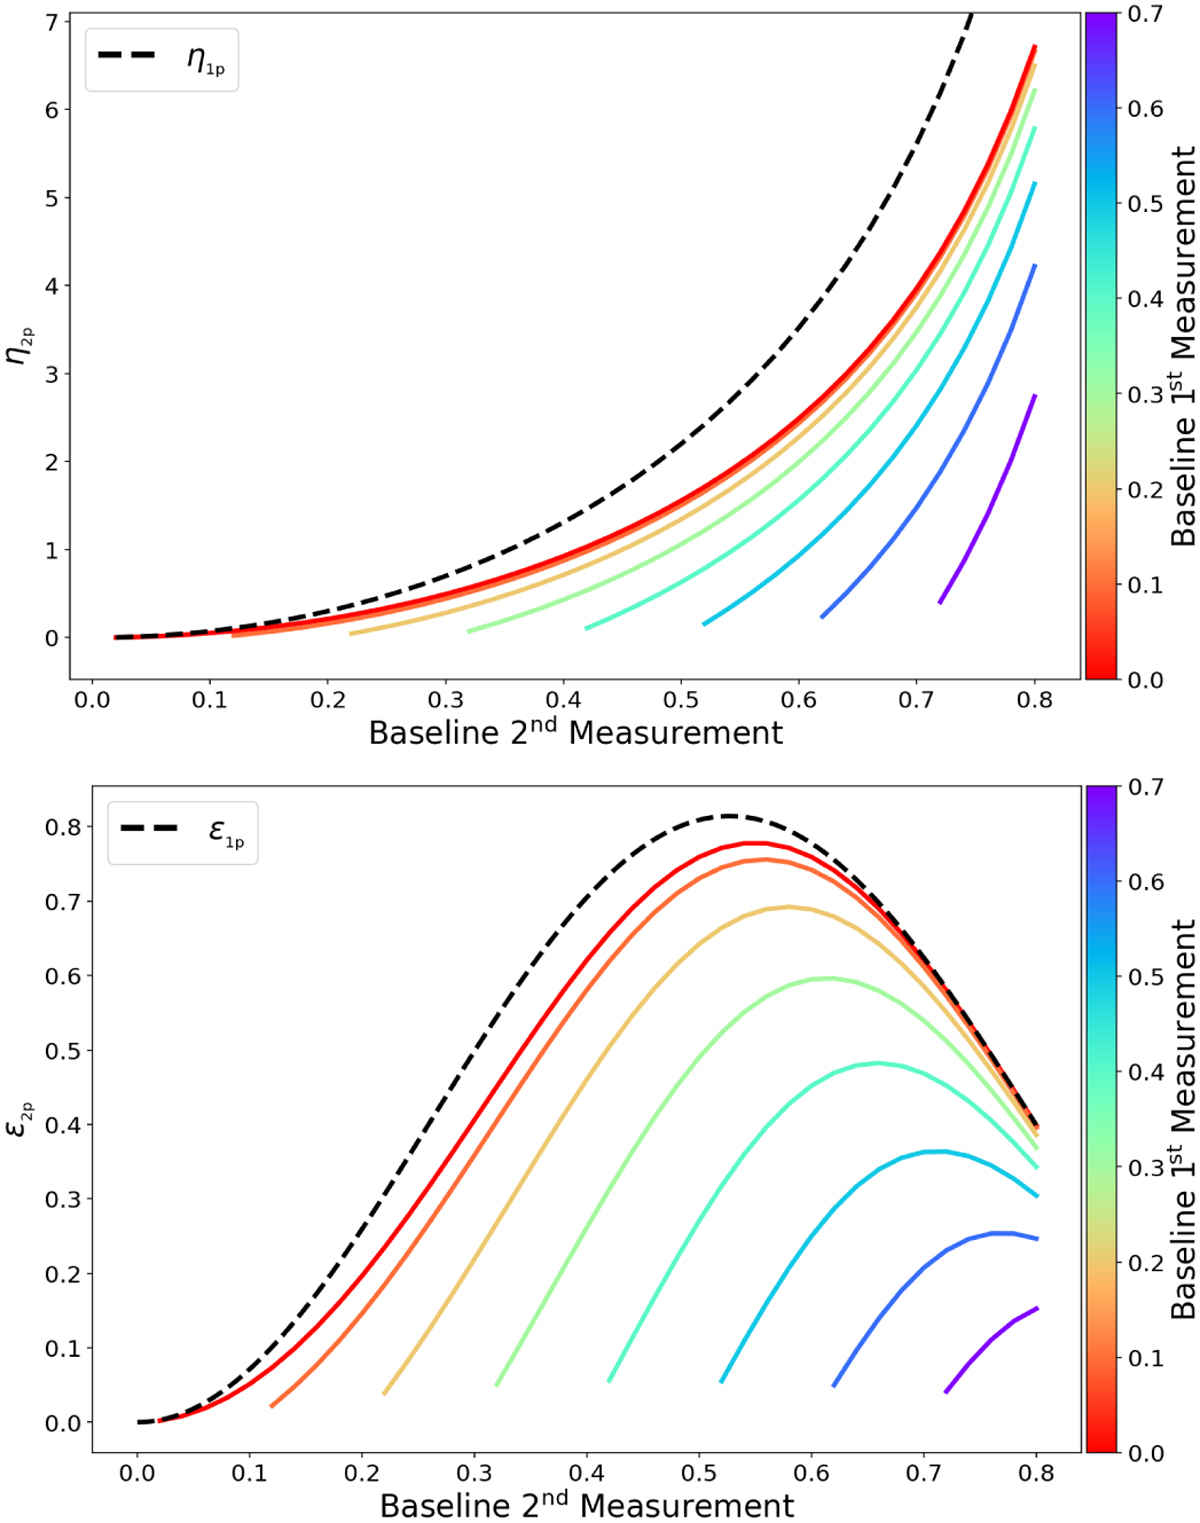
Fig. 5
Download original image
Trend of η2p (upper panel) and ϵ2p (lower panel) coefficients as function of the baselines of the first measurement (differently coloured curves) and of the second measurement (x-axis). We show as dashed black curves the trends of η1p and ϵ1p (already shown in Fig. 3) for comparison. The redder curves in the plots correspond to the trends of ηZBC and ϵZBC, when the ZBC value is directly measured.
Current usage metrics show cumulative count of Article Views (full-text article views including HTML views, PDF and ePub downloads, according to the available data) and Abstracts Views on Vision4Press platform.
Data correspond to usage on the plateform after 2015. The current usage metrics is available 48-96 hours after online publication and is updated daily on week days.
Initial download of the metrics may take a while.