Fig. 4
Download original image
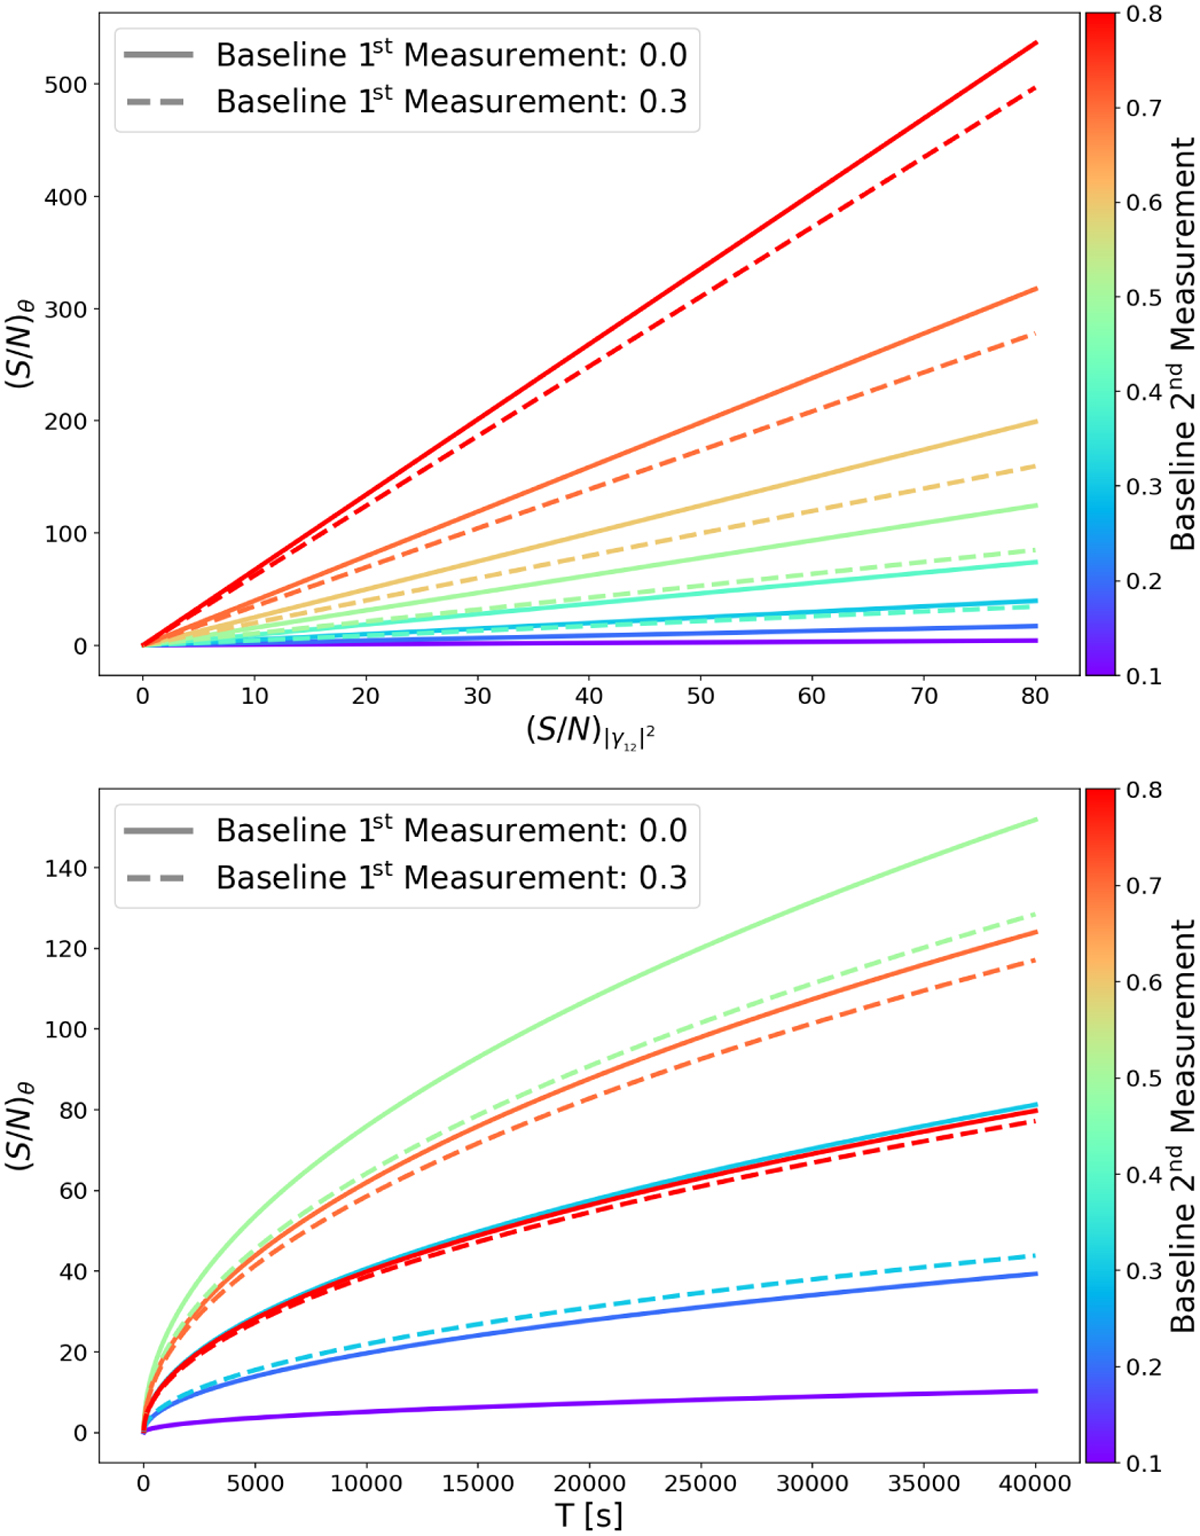
Trend of (S/N)θ as a function of ![]() (upper panel) and of the integration time (lower panel). Solid curves correspond to the cases in which the normalised baseline of the first measurement is at d1 /d0 = 0.0, and dashed curves correspond to the cases in which the baseline of the first measurement is at d1/d0 = 0.3 (value chosen to ensure a clear separation between the dashed and continuous curves). The differently coloured curves depend on the normalised baseline of the second measurement.
(upper panel) and of the integration time (lower panel). Solid curves correspond to the cases in which the normalised baseline of the first measurement is at d1 /d0 = 0.0, and dashed curves correspond to the cases in which the baseline of the first measurement is at d1/d0 = 0.3 (value chosen to ensure a clear separation between the dashed and continuous curves). The differently coloured curves depend on the normalised baseline of the second measurement.
Current usage metrics show cumulative count of Article Views (full-text article views including HTML views, PDF and ePub downloads, according to the available data) and Abstracts Views on Vision4Press platform.
Data correspond to usage on the plateform after 2015. The current usage metrics is available 48-96 hours after online publication and is updated daily on week days.
Initial download of the metrics may take a while.