Fig. 10
Download original image
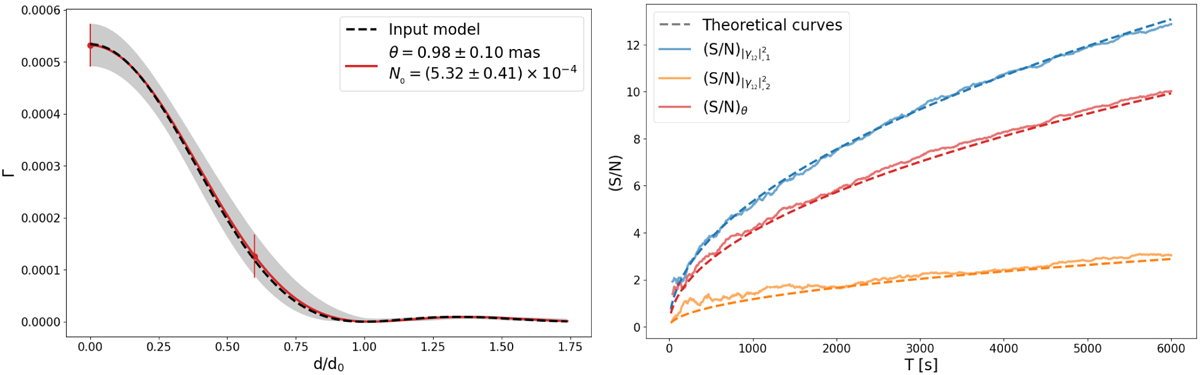
Results of the realistic simulation (averaged over ten realisations to reduce the statistical uncertainty of the single simulation). Left: fitted visibility function. The red measurements show the simulated data, the red curve shows the fitted model, the dashed black curve shows the input model (Table 1) and the gray shaded area is the 1σ confidence interval. Right: trends of ![]() for the two measurements (blue and orange continuous curves) and of (S/N)θ (red continuous curve) as a function of the integration time. The measured curves are compared to the theoretical predictions (dashed curves) from Eqs. (27) and (28).
for the two measurements (blue and orange continuous curves) and of (S/N)θ (red continuous curve) as a function of the integration time. The measured curves are compared to the theoretical predictions (dashed curves) from Eqs. (27) and (28).
Current usage metrics show cumulative count of Article Views (full-text article views including HTML views, PDF and ePub downloads, according to the available data) and Abstracts Views on Vision4Press platform.
Data correspond to usage on the plateform after 2015. The current usage metrics is available 48-96 hours after online publication and is updated daily on week days.
Initial download of the metrics may take a while.