Fig. 7
Download original image
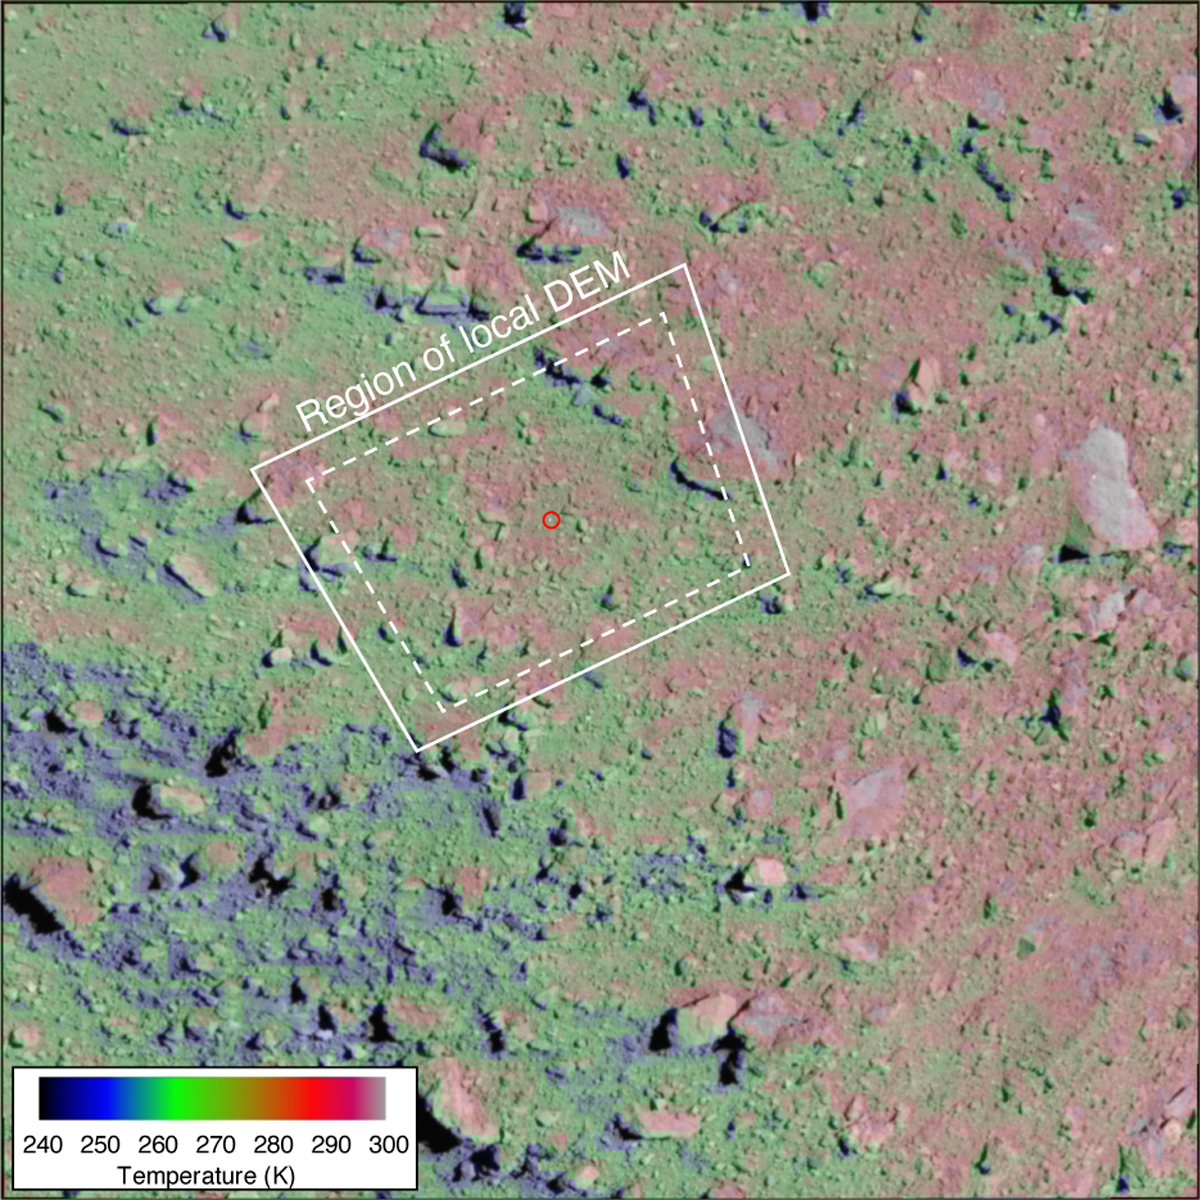
TIR brightness temperature image 20190321_190509_12 registered to ONC-T image 20190321_190554_tvf. The bright spot inside the red circle is the MASCOT lander. The solid white box marks the region covered by the local DEM for which we performed the thermal simulations. The dashed white box marks the region for which we derived the thermal inertia (see Fig. 8).
Current usage metrics show cumulative count of Article Views (full-text article views including HTML views, PDF and ePub downloads, according to the available data) and Abstracts Views on Vision4Press platform.
Data correspond to usage on the plateform after 2015. The current usage metrics is available 48-96 hours after online publication and is updated daily on week days.
Initial download of the metrics may take a while.