Fig. 6
Download original image
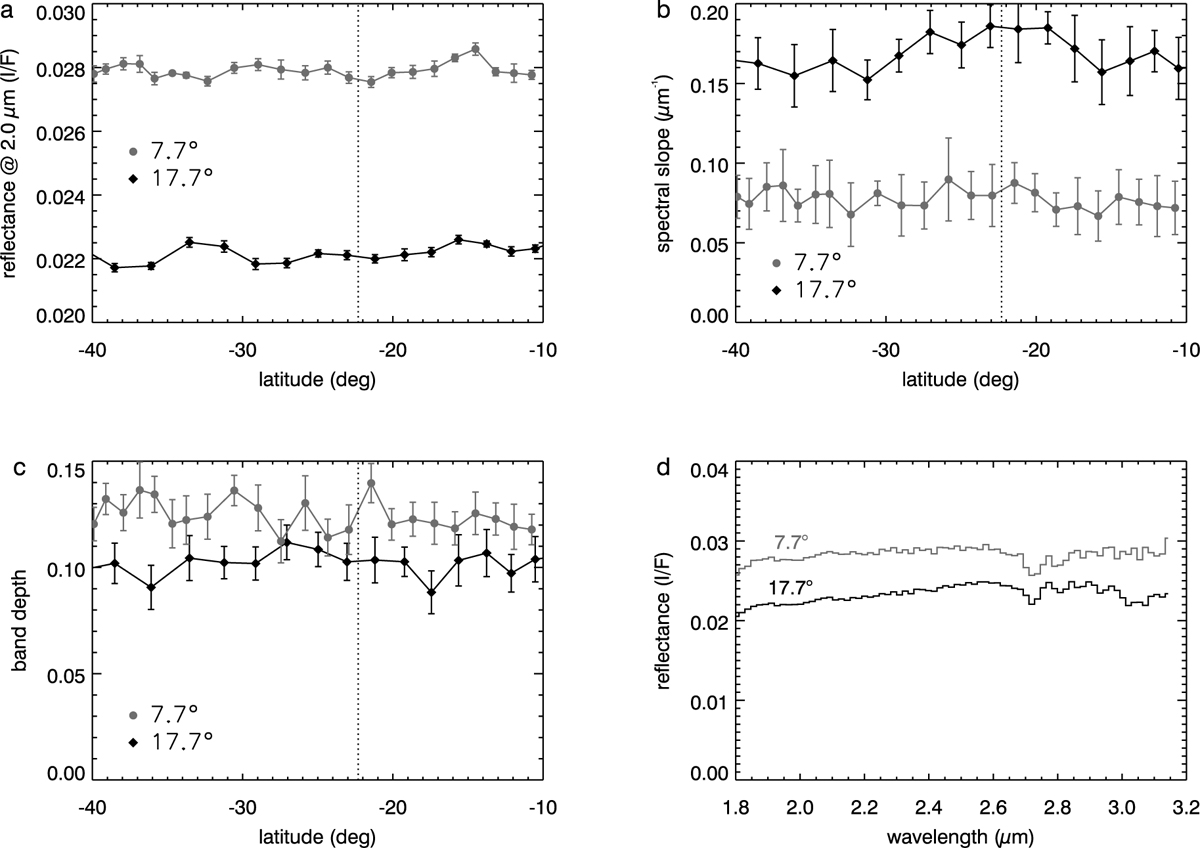
Spectral properties of the MASCOT landing area from the NIRS3 transects in Fig. 5. (a) Reflectance at 2.0 µm along the transects, (b) Near-IR spectral slope along the transects, (c) Depth of the 2.72 µm band along the transects, (d) Spectra associated with footprints that cover the landing site, marked as green in Fig. 5. The dotted line in panels a–c indicates the latitude of the landing site.
Current usage metrics show cumulative count of Article Views (full-text article views including HTML views, PDF and ePub downloads, according to the available data) and Abstracts Views on Vision4Press platform.
Data correspond to usage on the plateform after 2015. The current usage metrics is available 48-96 hours after online publication and is updated daily on week days.
Initial download of the metrics may take a while.