Fig. A.1

Download original image
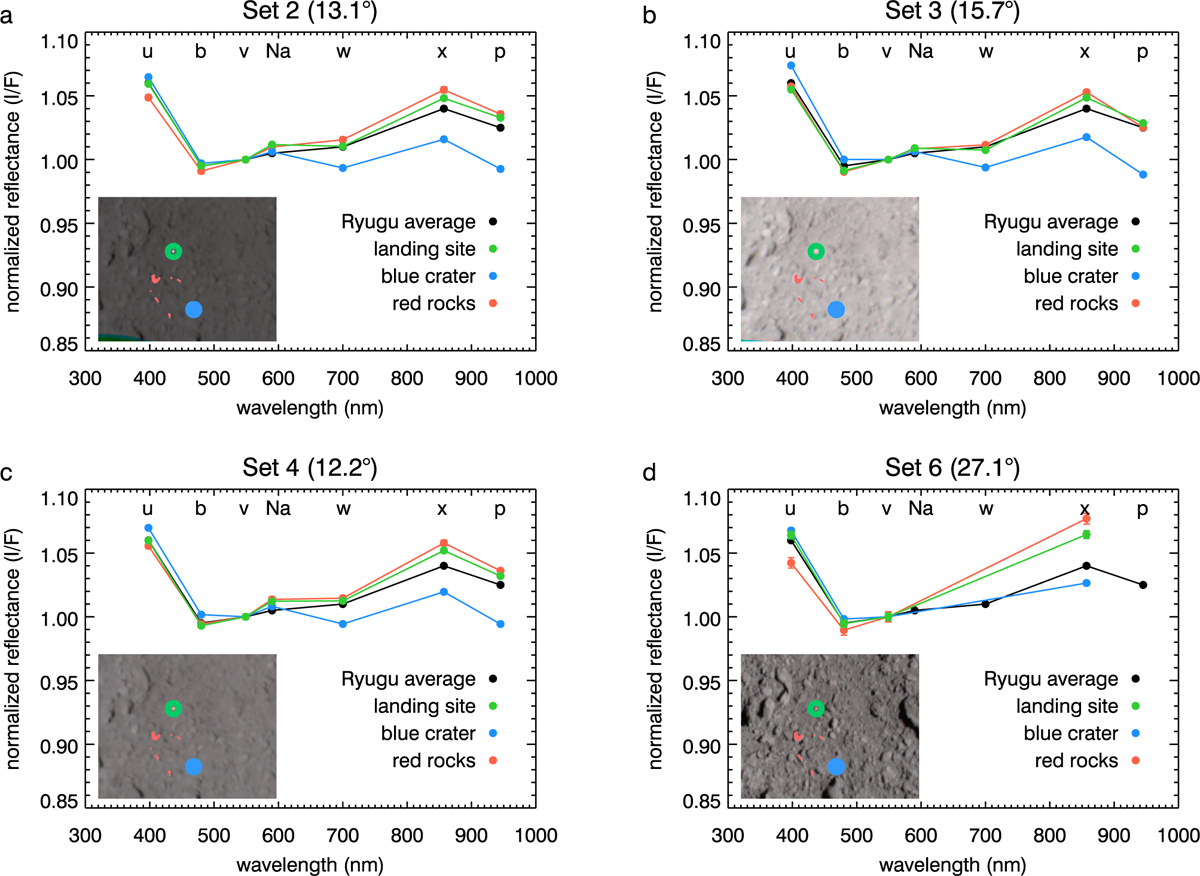
Spectra of different terrain units in the MASCOT landing area for ONC image sets 2 (a), 3 (b), 4 (c), and 6 (d), with the average phase angle indicated in the plot title. Error bars indicate the standard error of the mean and are generally smaller than the plot symbols. The insets show color composites of the respective sets, including the locations of the pixels that were averaged for each unit in the legend. The “landing site” unit excludes the lander itself. Spectra are normalized at 550 nm, and letters correspond to ONC filter names. The Ryugu average spectrum is that for the 19.5° phase angle in Fig. 4 of Tatsumi et al. (2020a).
Current usage metrics show cumulative count of Article Views (full-text article views including HTML views, PDF and ePub downloads, according to the available data) and Abstracts Views on Vision4Press platform.
Data correspond to usage on the plateform after 2015. The current usage metrics is available 48-96 hours after online publication and is updated daily on week days.
Initial download of the metrics may take a while.


