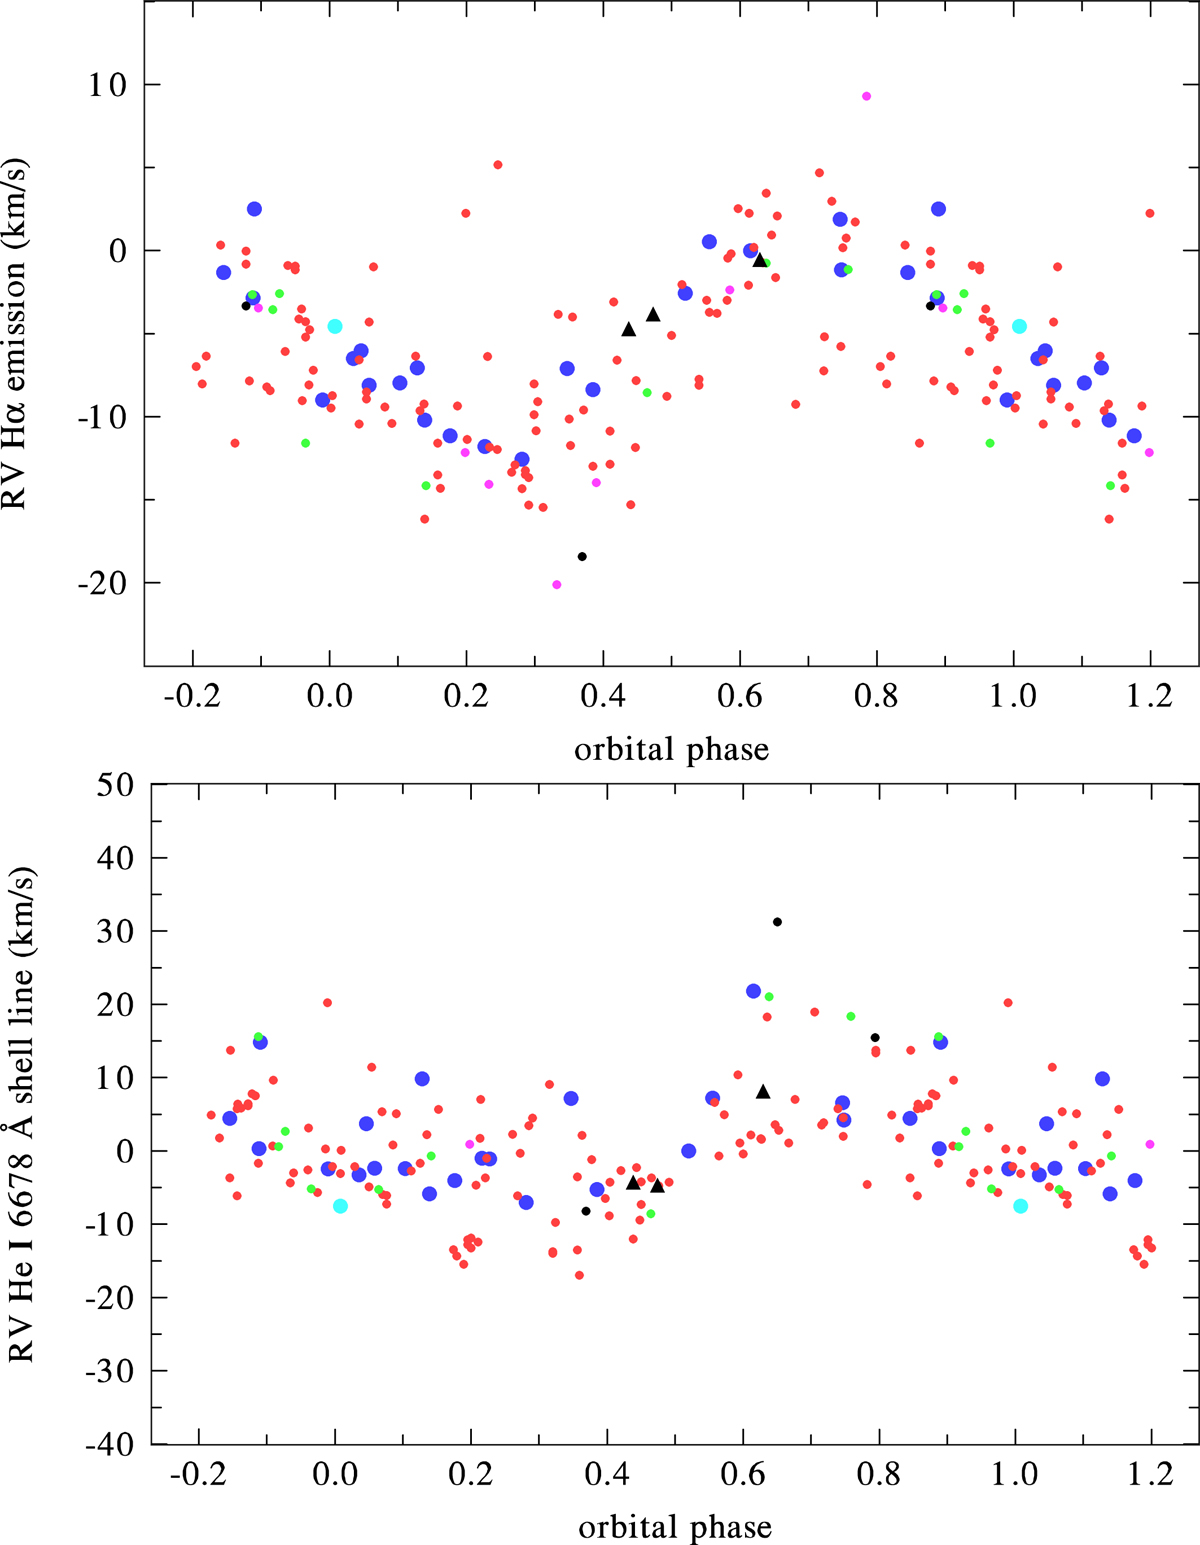
Fig. 7.
Download original image
Radial-velocity curve corresponding to the orbital solution, based on RVs measured on the steep wings of the Hα emission, plotted for phases from ephemeris (top; eq. (1)). Orbital curve based on RV of the He I 6678 Å shell line prewhitened for the long-term changes, plotted for the same ephemeris (bottom). Data from individual instruments are shown by different symbols. The circles are the same as in Fig. 2, and black triangle shows CTIO.
Current usage metrics show cumulative count of Article Views (full-text article views including HTML views, PDF and ePub downloads, according to the available data) and Abstracts Views on Vision4Press platform.
Data correspond to usage on the plateform after 2015. The current usage metrics is available 48-96 hours after online publication and is updated daily on week days.
Initial download of the metrics may take a while.