Fig. 6.
Download original image
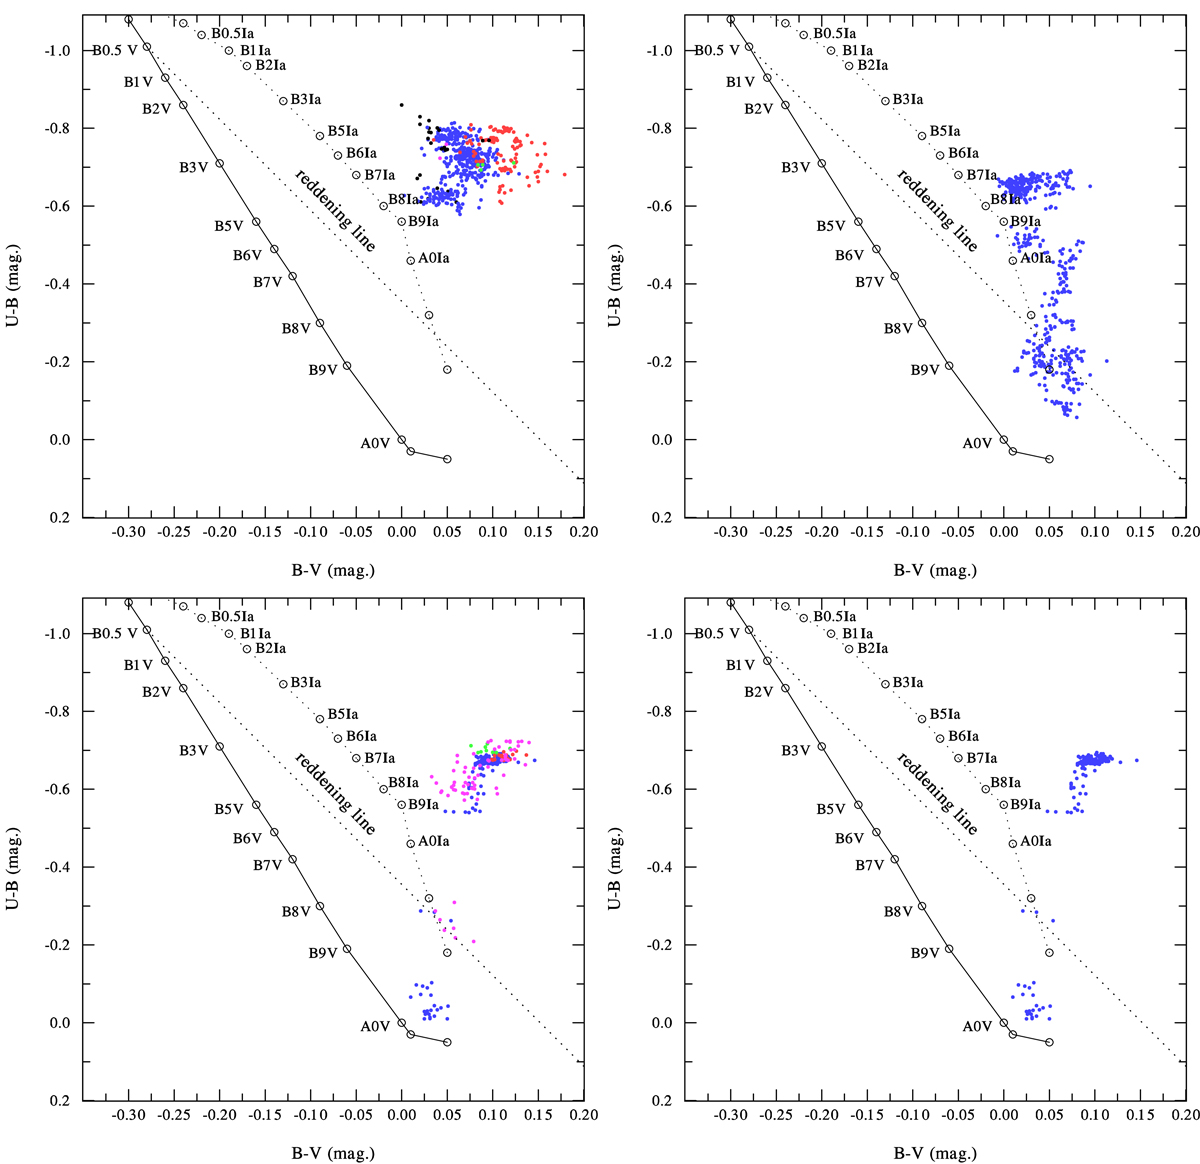
U−B vs. B−V diagram for several distinct data subsets. Top panels: older data until JD 2450000 (left). All-sky observations are shown as black circles, and data from stations defined in Table 2 are denoted as follows: 01 (blue), 04 (green), 12 (red), and 26 (magenta). More recent data from the interval of secular light brightening, all from station 01 (blue) (right). Bottom panels: show UBV observations from the two sharp increases in the emission-line strength accompanied by light decreases. Time interval JD 2452741 – 2453309, which covers the first sharp light decrease (left, cf. Figs. 1 and 3.) Data from the time interval JD 2455357 – 2456094 corresponding to the second sharp increase in the emission-line strength (right). Data from stations 1, 30, 66, and 89 of Table 2 are shown by blue, red, green, and magenta dots, respectively. The main sequence and the supergiant sequence based on data from Golay (1974) (pp. 79–80) are shown, as is the reddening line.
Current usage metrics show cumulative count of Article Views (full-text article views including HTML views, PDF and ePub downloads, according to the available data) and Abstracts Views on Vision4Press platform.
Data correspond to usage on the plateform after 2015. The current usage metrics is available 48-96 hours after online publication and is updated daily on week days.
Initial download of the metrics may take a while.