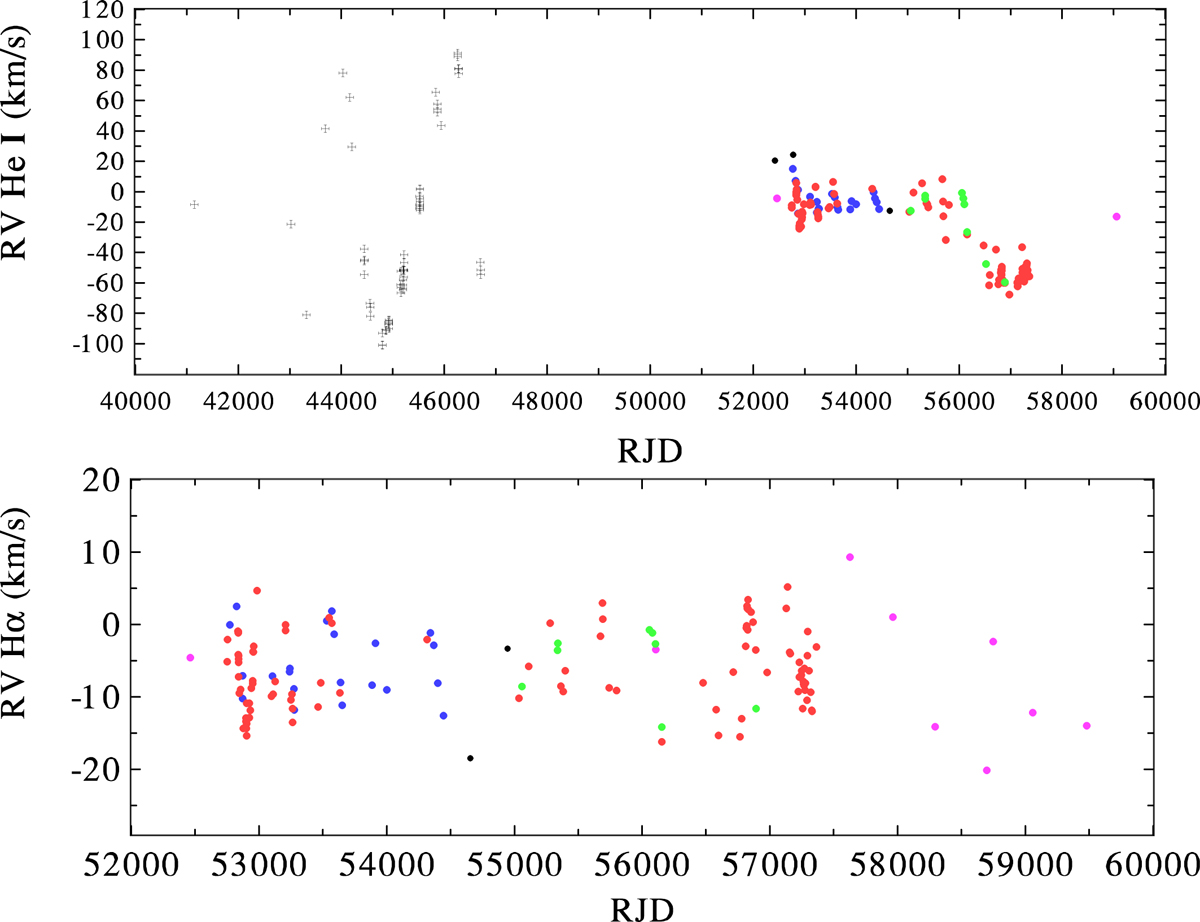
Fig. 5.
Download original image
Time plot of radial velocities. Top panel: RV of the He I shell lines. Bottom panel: RV measured on the steep wings of the Hα emission. Data from individual instruments are shown by different symbols: the circles are the same as in Fig. 2, and black crosses plot data from Ballereau & Chauville (1989). The ranges on the two axes in the two plots are different.
Current usage metrics show cumulative count of Article Views (full-text article views including HTML views, PDF and ePub downloads, according to the available data) and Abstracts Views on Vision4Press platform.
Data correspond to usage on the plateform after 2015. The current usage metrics is available 48-96 hours after online publication and is updated daily on week days.
Initial download of the metrics may take a while.