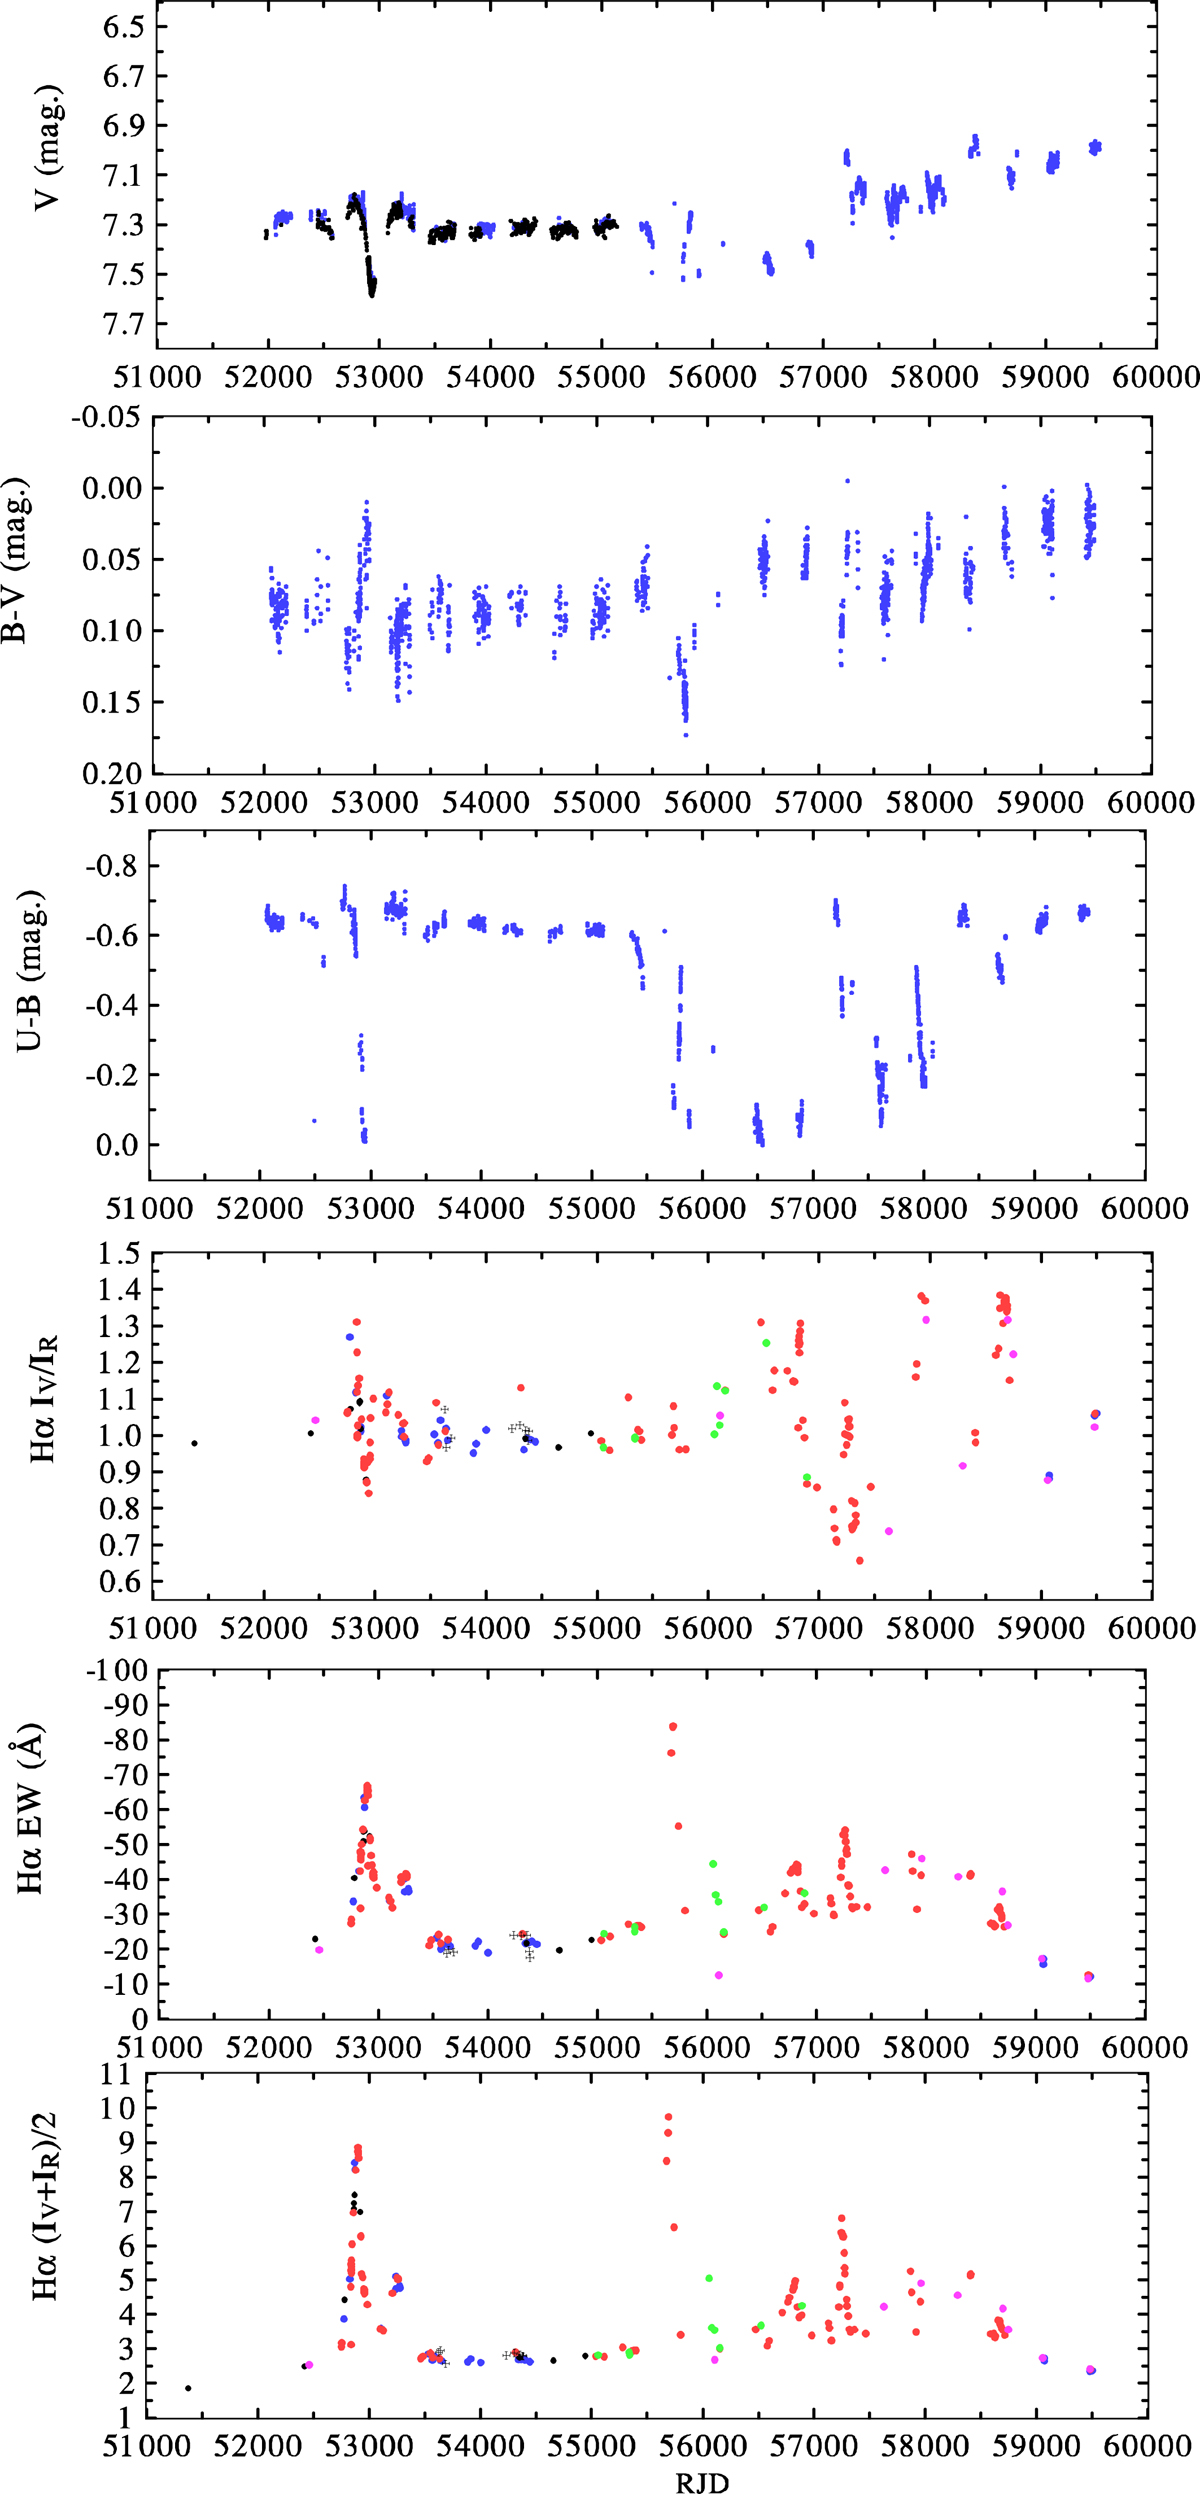
Fig. 3.
Download original image
Time plot showing the correlation between the secular brightness and colour variations in the V-band magnitudes and B−V and U−B colour indices (black shows all-sky and blue shows differential observations), and the V/R changes, EW, and strength of the Hα emission for the more recent electronic spectra. The colour symbols for spectra from different sources are the same as in Fig. 2.
Current usage metrics show cumulative count of Article Views (full-text article views including HTML views, PDF and ePub downloads, according to the available data) and Abstracts Views on Vision4Press platform.
Data correspond to usage on the plateform after 2015. The current usage metrics is available 48-96 hours after online publication and is updated daily on week days.
Initial download of the metrics may take a while.