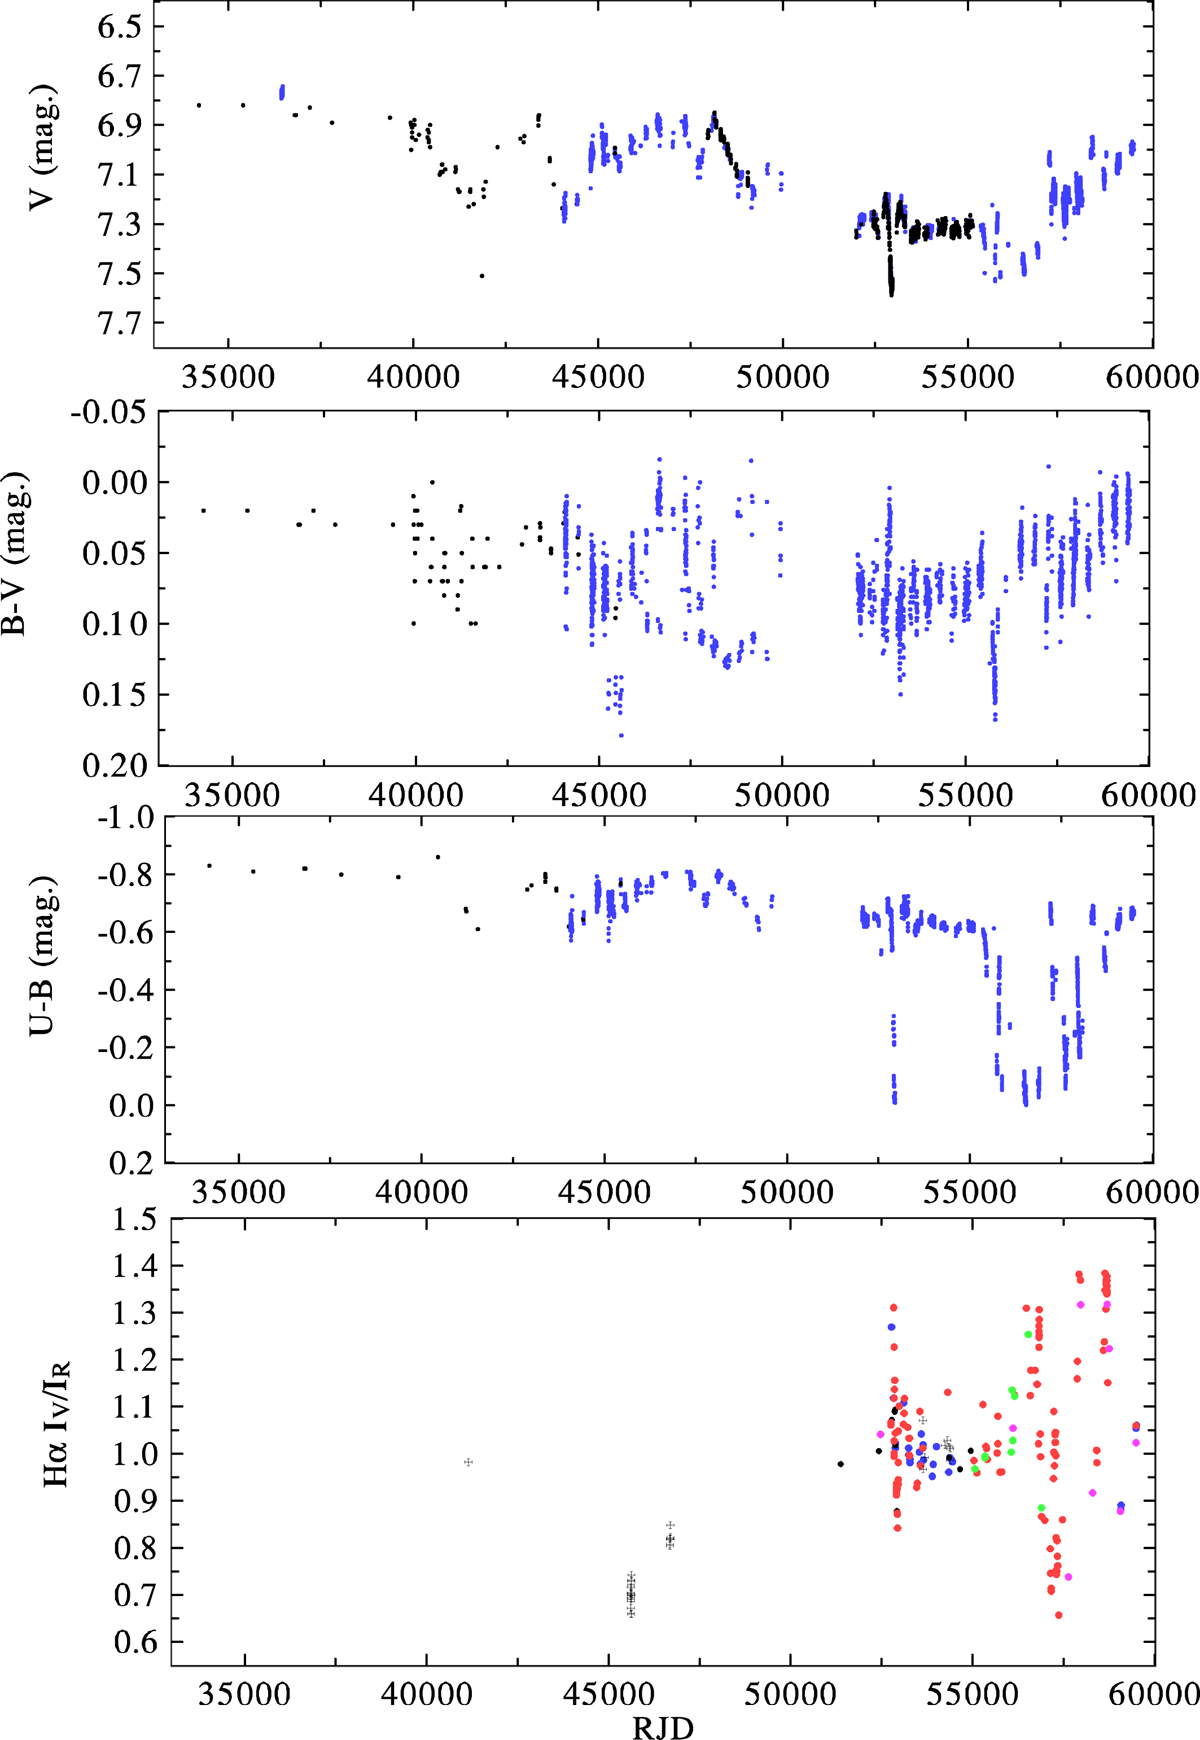
Fig. 2.
Download original image
Time plot of available observations over the whole time interval of about 25 000 d covered by the data. Top panel: yellow brightness observations, which could be transformed into Johnson V magnitude. Second and third panel: available B−V and U−B colour index observations. Bottom panel: V/R changes in the peaks of the double Hα emission. In the three panels with photometry, the differential observations are shown as blue dots, and all-sky observations are shown as black dots. Bottom panel: blue circles denote the DAO spectra, red circles show the OND spectra, green circles represent BESO spectra, magenta circles show BeSS spectra, black circles show Castanet Tolosan spectra, and the black crosses plot the data from the literature.
Current usage metrics show cumulative count of Article Views (full-text article views including HTML views, PDF and ePub downloads, according to the available data) and Abstracts Views on Vision4Press platform.
Data correspond to usage on the plateform after 2015. The current usage metrics is available 48-96 hours after online publication and is updated daily on week days.
Initial download of the metrics may take a while.