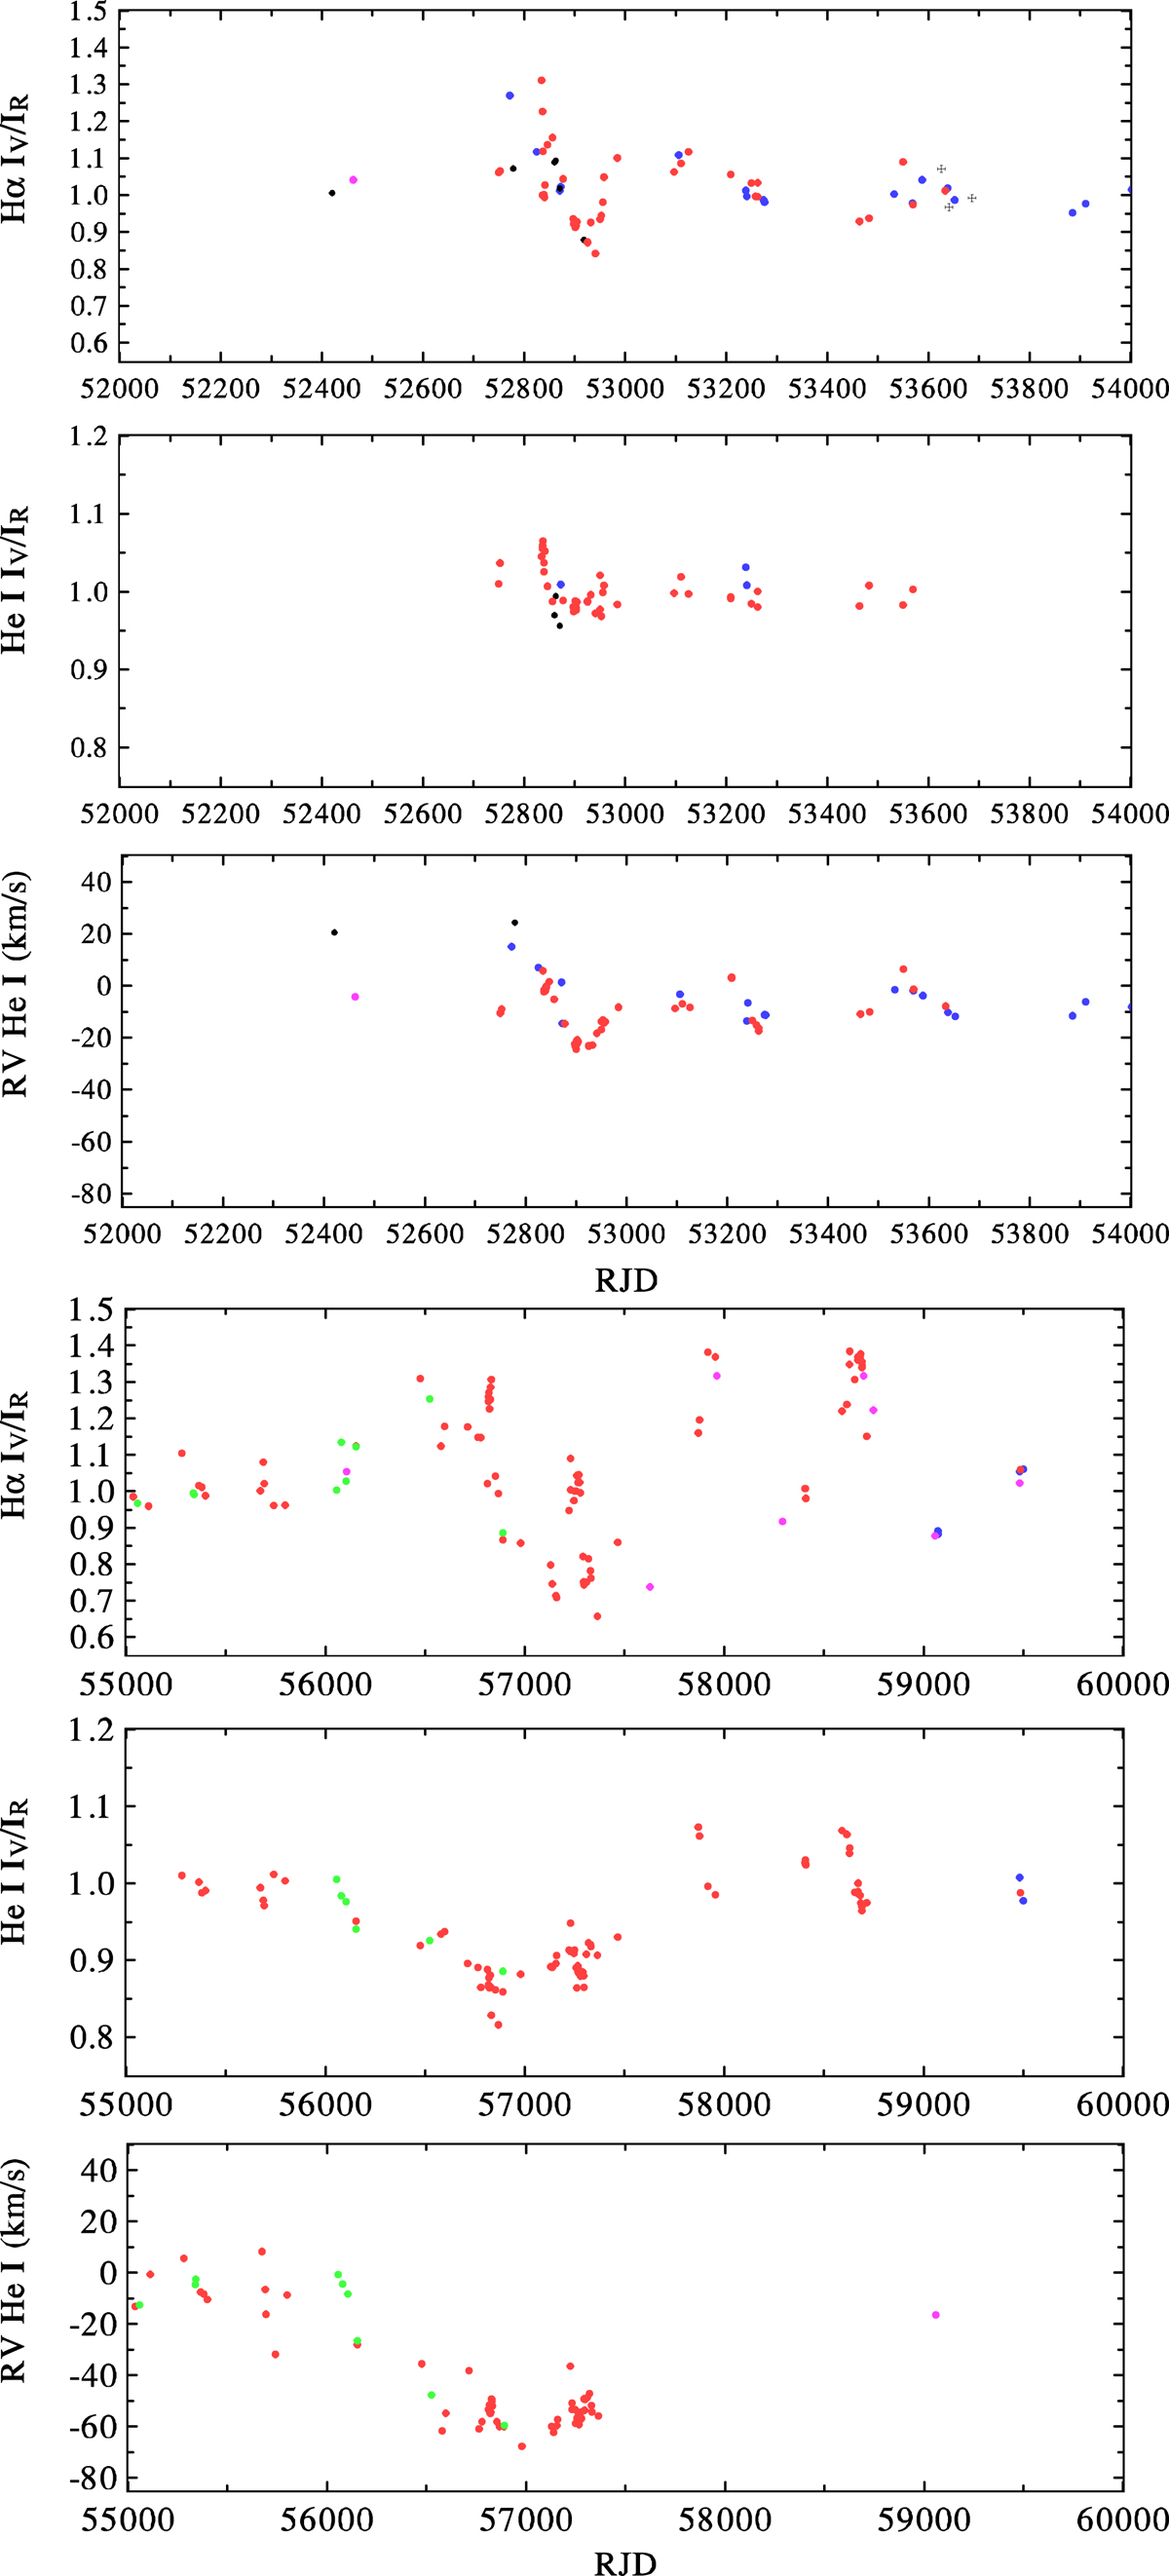
Fig. 14.
Download original image
Apparent V/R changes observed for the Hα and He I 6678 emission lines intercompared for two time segments. The variation in the shell He RV is also shown. An apparently anti-phase behaviour is observed in the second time interval, when the shell RV becomes quite negative and the He shell line blends with the V peak of the faint He emission. The same colours as in the previous time plots are used to distinguish spectra from individual observatories.
Current usage metrics show cumulative count of Article Views (full-text article views including HTML views, PDF and ePub downloads, according to the available data) and Abstracts Views on Vision4Press platform.
Data correspond to usage on the plateform after 2015. The current usage metrics is available 48-96 hours after online publication and is updated daily on week days.
Initial download of the metrics may take a while.