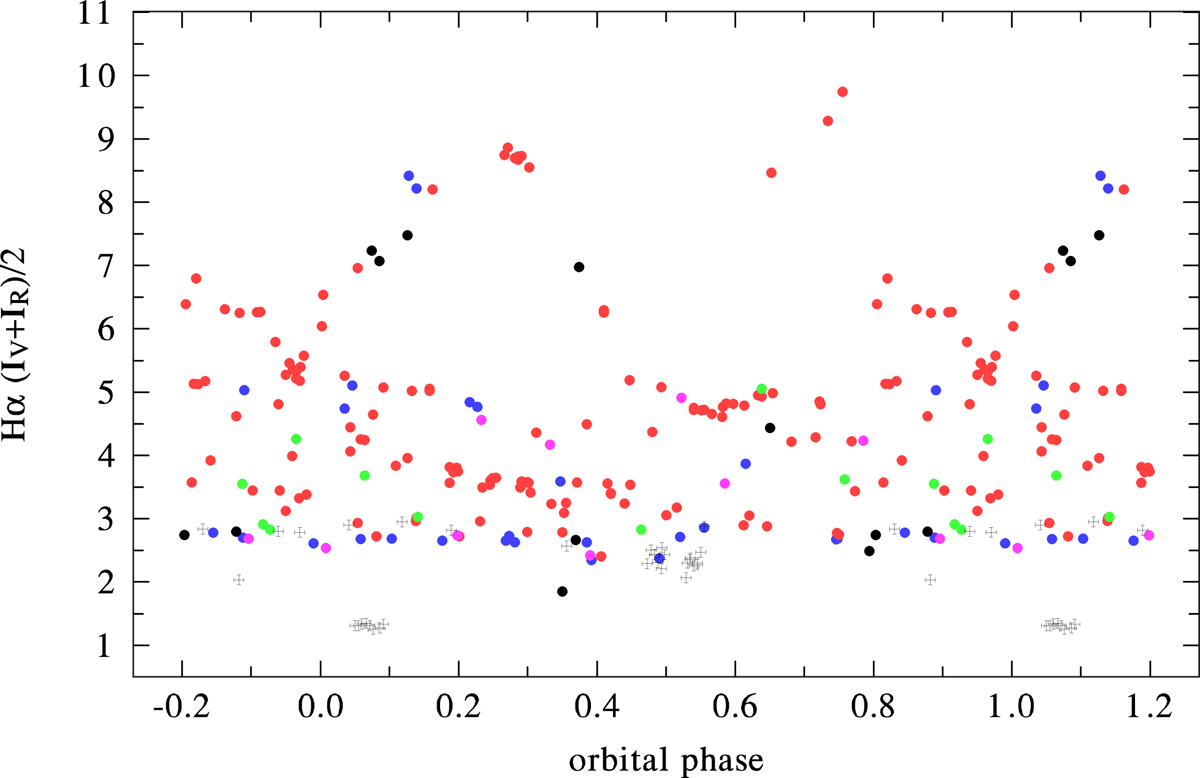
Fig. 10.
Download original image
Phase plots of the strength of the Hα emission for binary ephemeris (Eq. (1)). Data from individual sources are denoted as follows: Circles in blue show DAO spectra, red circles show OND spectra, green circles represent BESO spectra, magenta circles show BeSS, and black circles show Castanet spectra. The black crosses show data from the literature.
Current usage metrics show cumulative count of Article Views (full-text article views including HTML views, PDF and ePub downloads, according to the available data) and Abstracts Views on Vision4Press platform.
Data correspond to usage on the plateform after 2015. The current usage metrics is available 48-96 hours after online publication and is updated daily on week days.
Initial download of the metrics may take a while.