Fig. A.1
Download original image
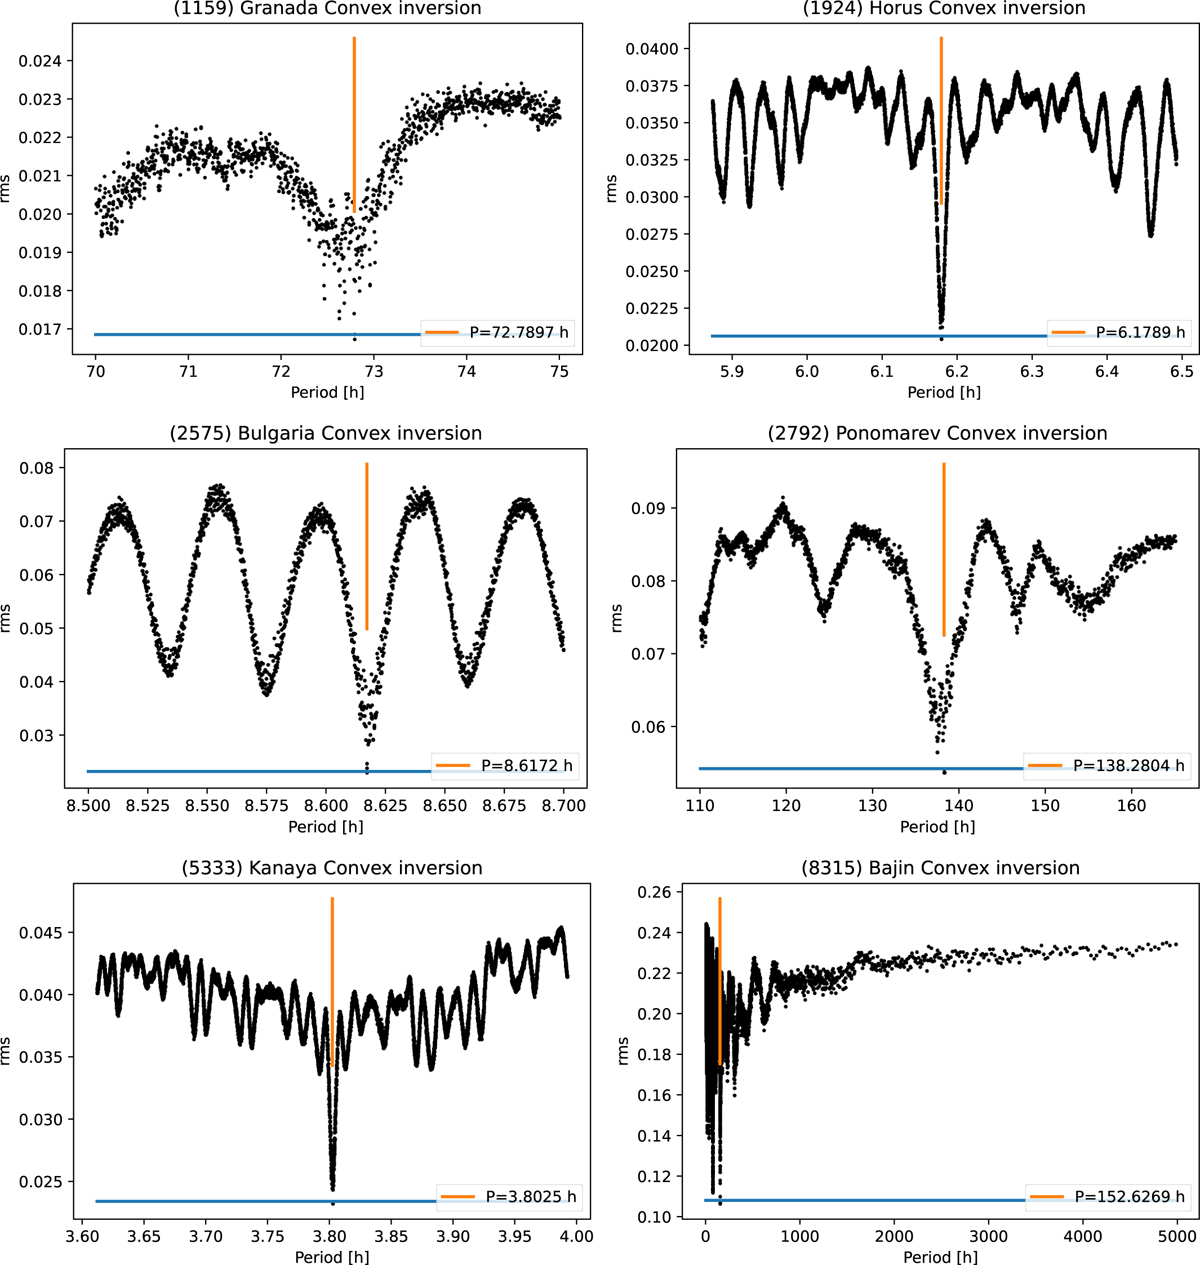
Typical periodograms of six different asteroids and their new shape model determinations. Each dot represents one trial run that samples all the local minima at a fixed rotation period (Eq. 2) within the searched interval. The vertical lines indicate the best-fit values. The horizontal line represents the χ2 threshold defined by Eq. 1.
Current usage metrics show cumulative count of Article Views (full-text article views including HTML views, PDF and ePub downloads, according to the available data) and Abstracts Views on Vision4Press platform.
Data correspond to usage on the plateform after 2015. The current usage metrics is available 48-96 hours after online publication and is updated daily on week days.
Initial download of the metrics may take a while.