Fig. 2
Download original image
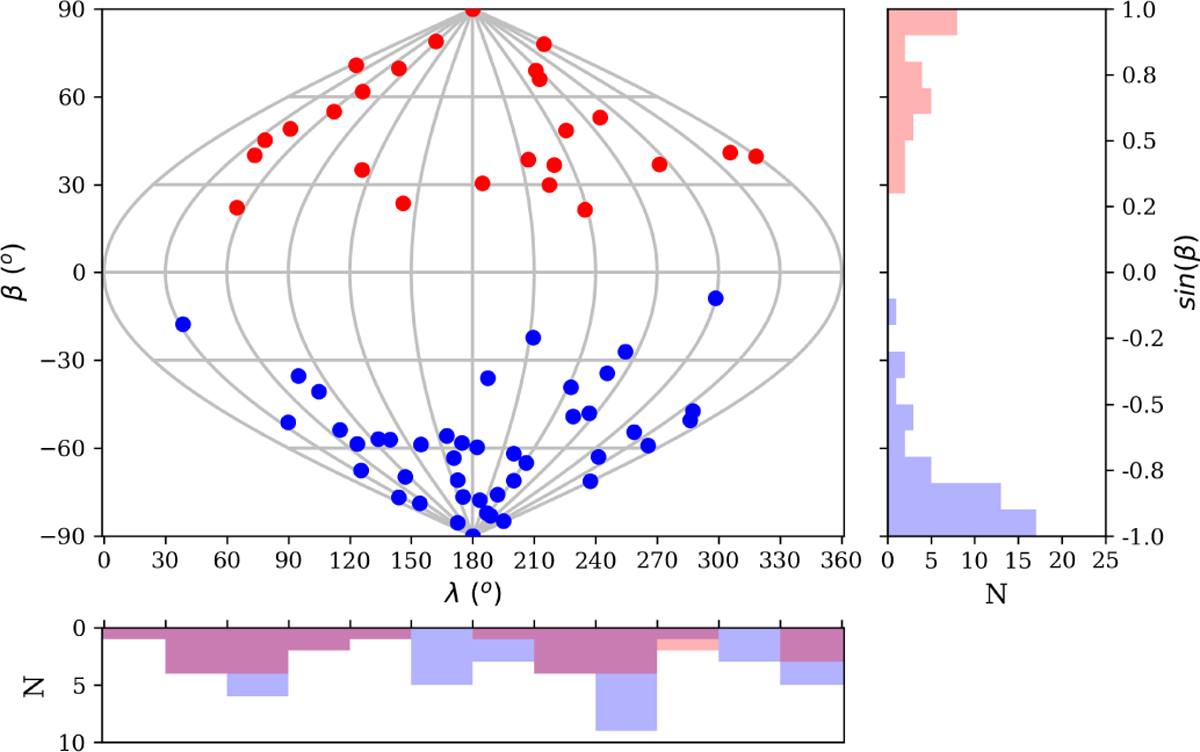
Distribution of the complete spin pole solutions for the primordial family members. The main plot is a sinusoidal equal-area cartographic representation, where the vertical grey lines define the longitude (λ) and the horizontal curves define the latitude (β). The right histogram represents the latitude (β) of prograde (red) and retrograde (blue) rotators. The bottom histogram represents the longitude (λ) of prograde (red) and retrograde (blue) rotators. The specific values for each asteroid are shown in Tables B.3 and B.4.
Current usage metrics show cumulative count of Article Views (full-text article views including HTML views, PDF and ePub downloads, according to the available data) and Abstracts Views on Vision4Press platform.
Data correspond to usage on the plateform after 2015. The current usage metrics is available 48-96 hours after online publication and is updated daily on week days.
Initial download of the metrics may take a while.