Open Access
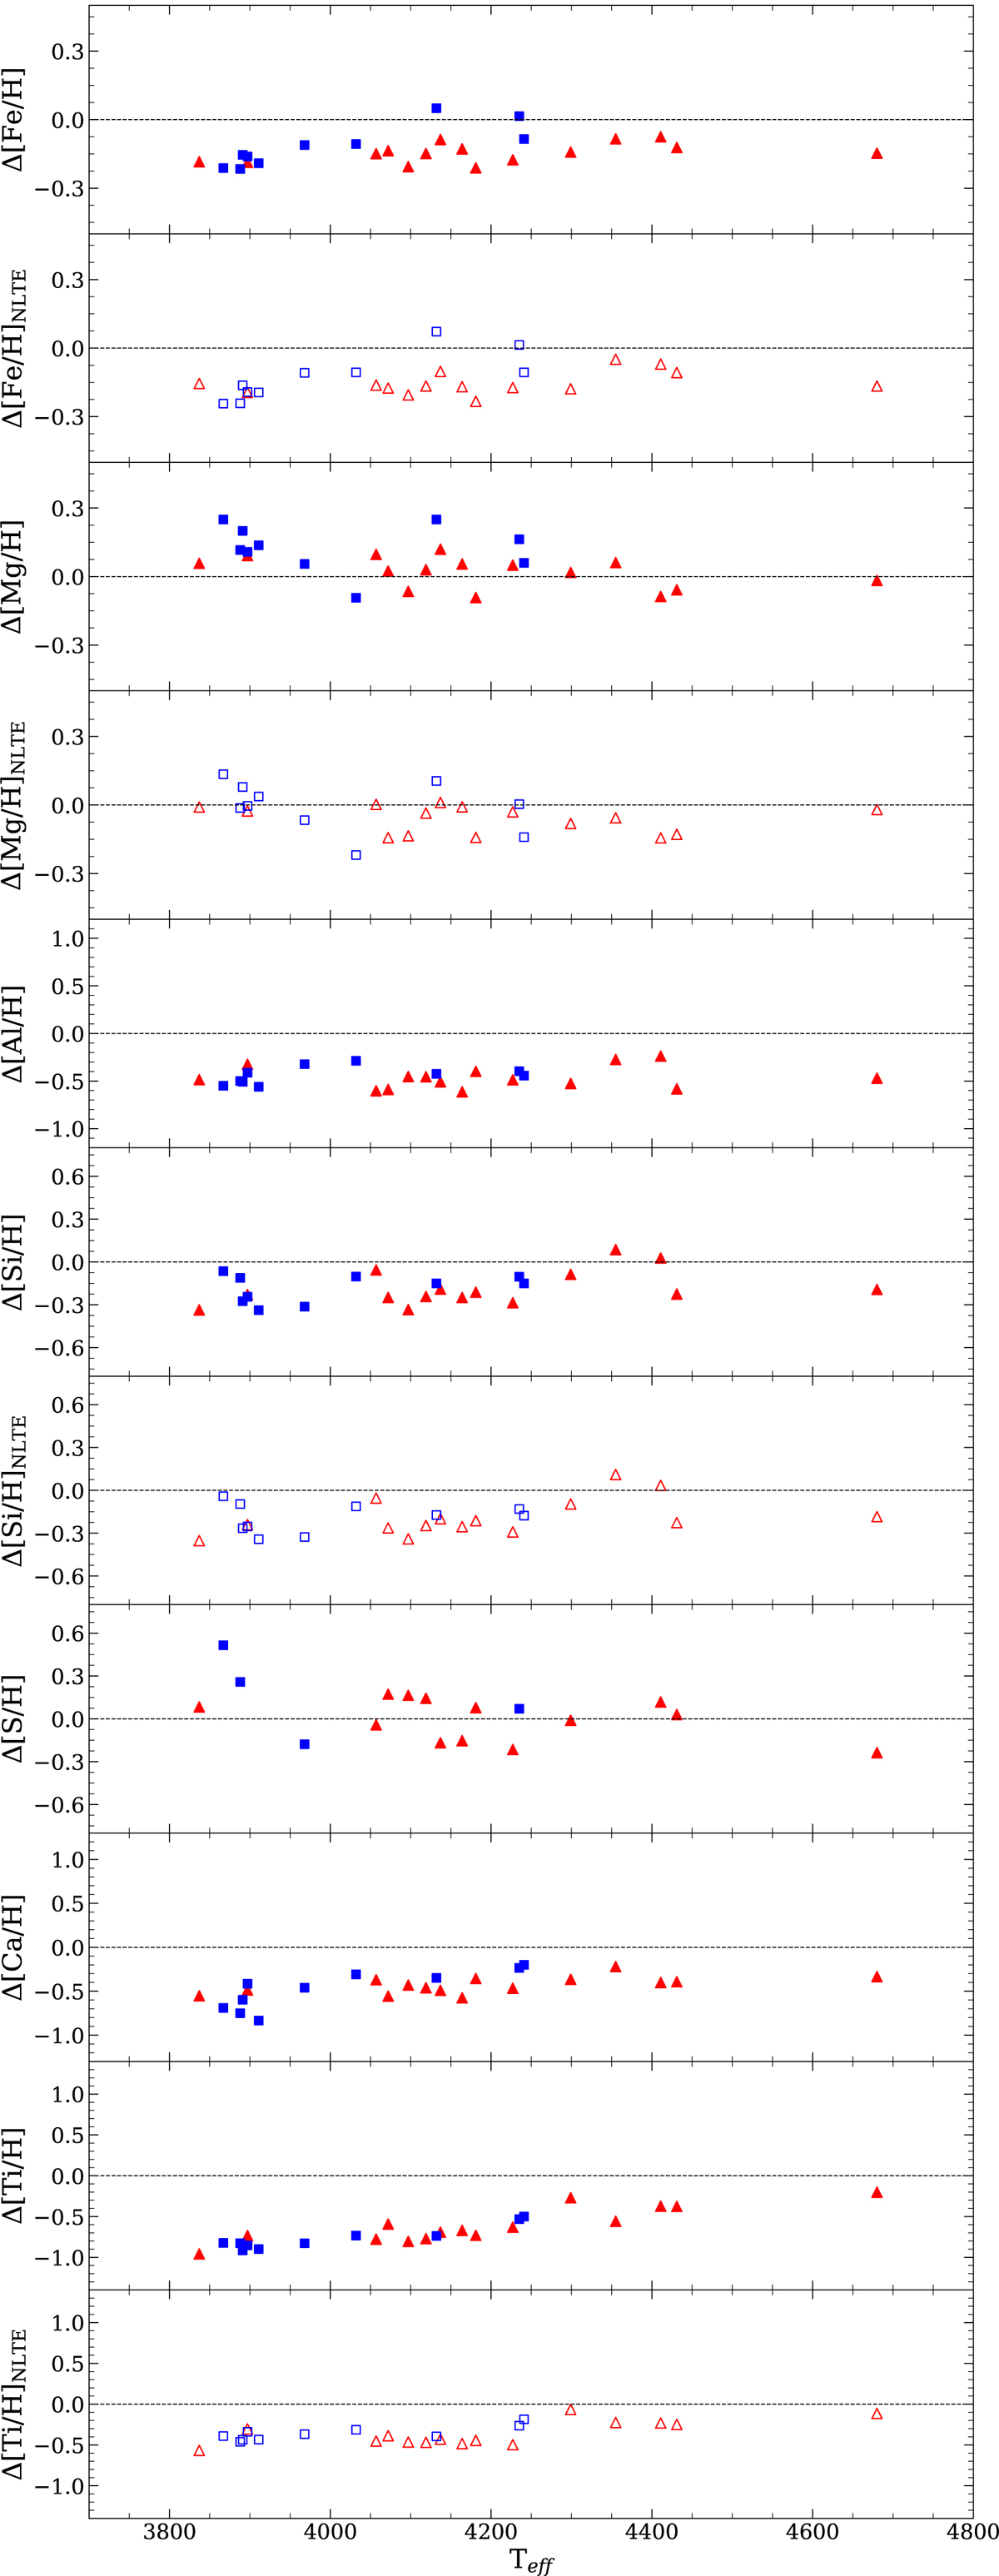
Fig. 7.
Download original image
Difference in chemical abundance ratios of [Fe, Mg, Al, Si, S, Ca, and Ti/H] derived from H- and K-band spectra depending on Teff. The symbols are the same as in Fig. 3, and open symbols show the abundance ratios after NLTE correction.
Current usage metrics show cumulative count of Article Views (full-text article views including HTML views, PDF and ePub downloads, according to the available data) and Abstracts Views on Vision4Press platform.
Data correspond to usage on the plateform after 2015. The current usage metrics is available 48-96 hours after online publication and is updated daily on week days.
Initial download of the metrics may take a while.