Open Access
Fig. 5.
Download original image
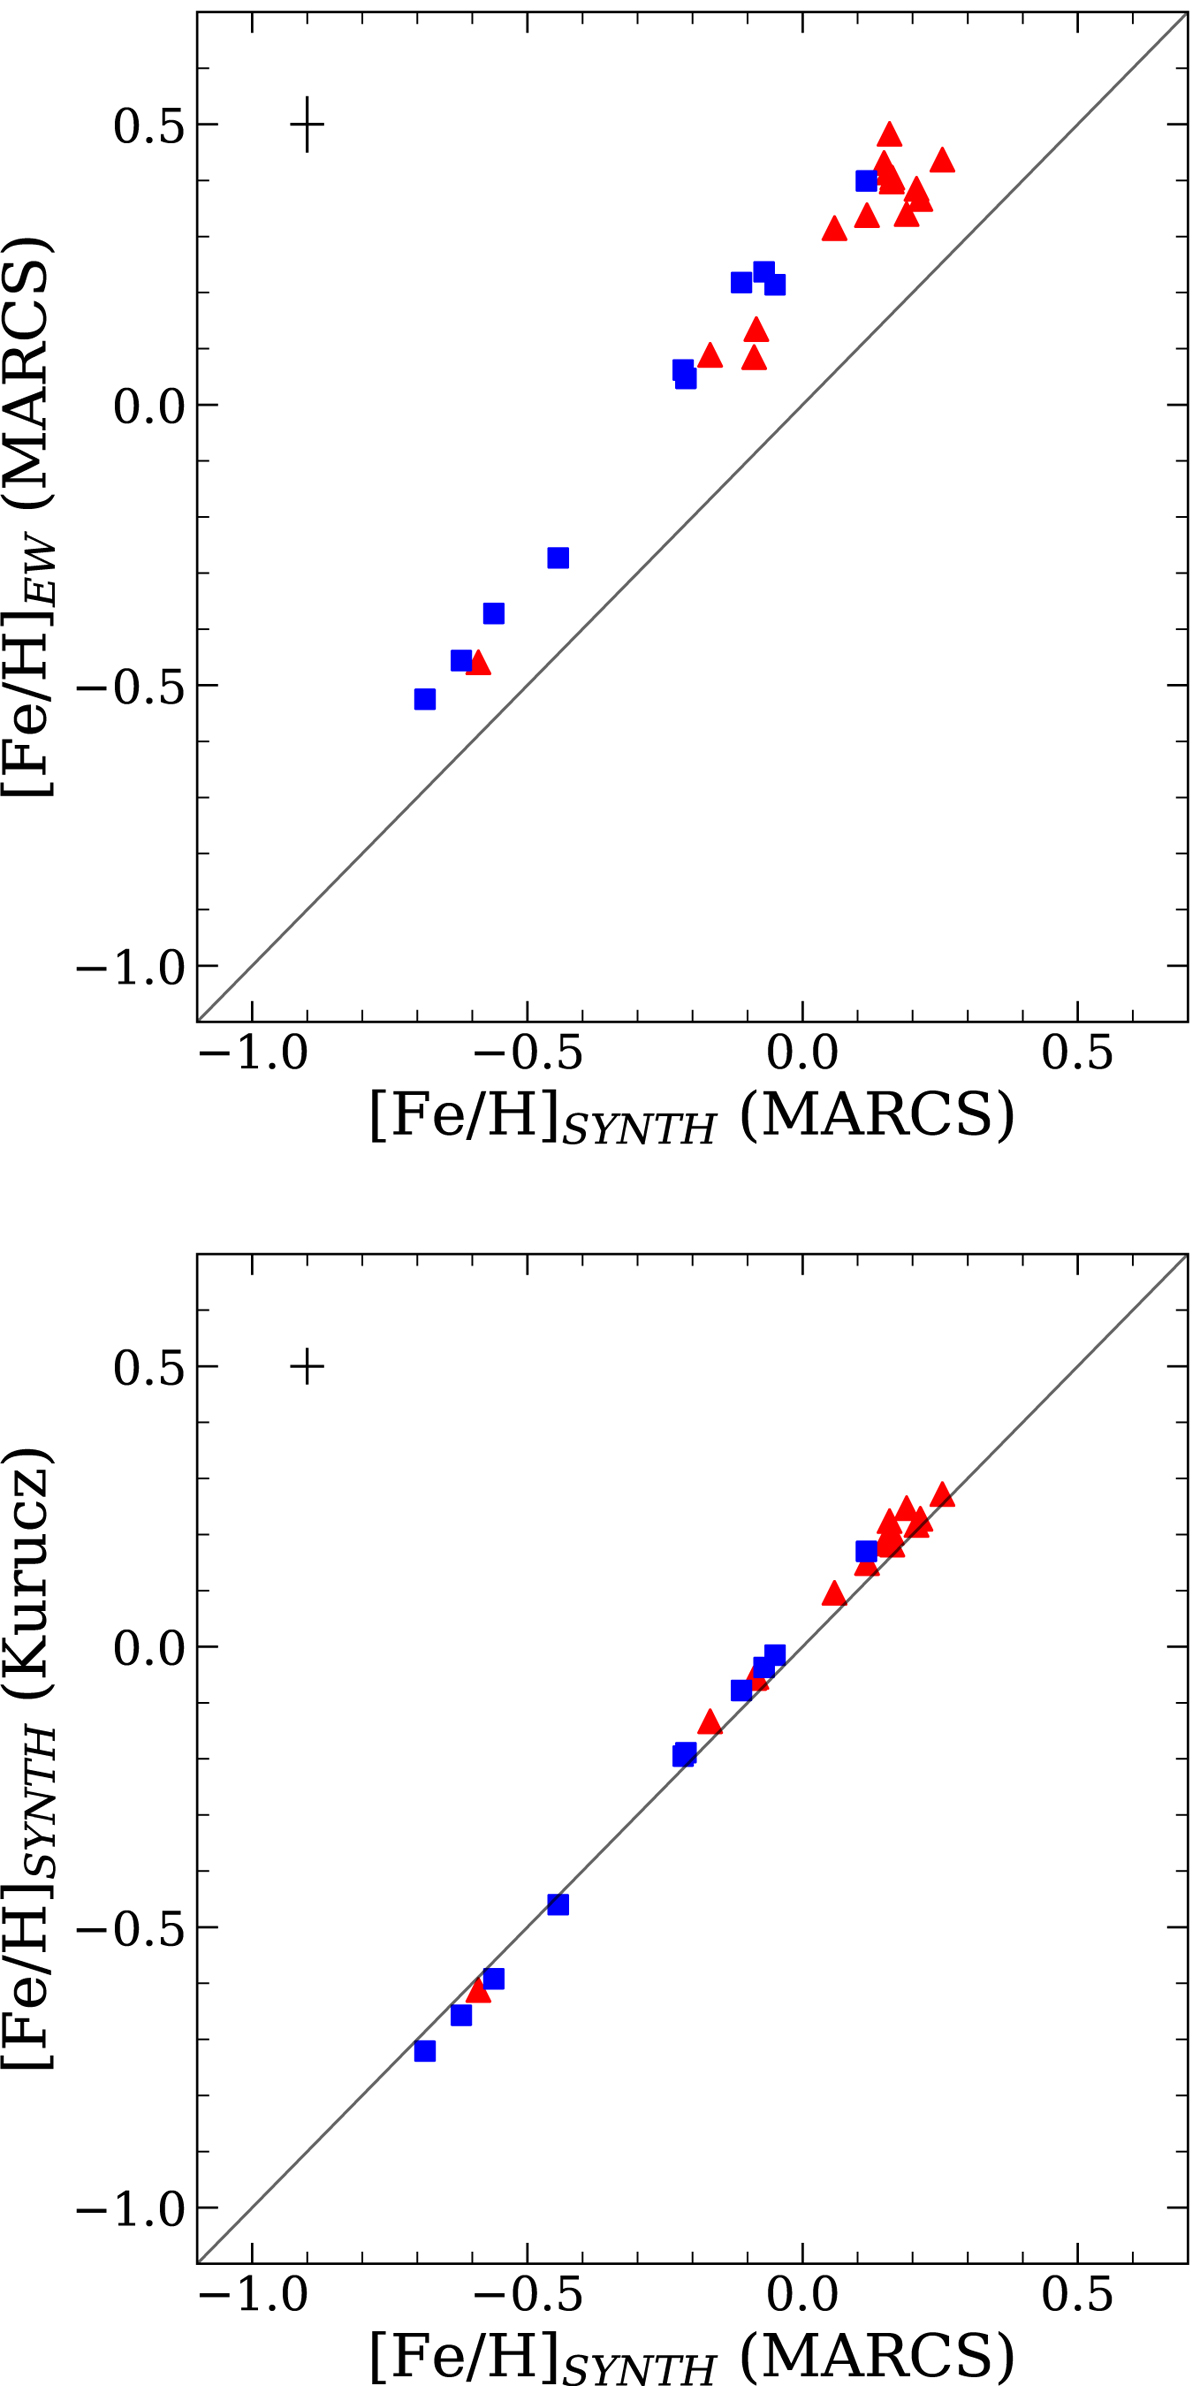
Comparison of [Fe/H] abundance ratio derived from spectrum synthesis and EW measurement with MARCS models (upper panel), and comparison of [Fe/H] using MARCS and Kurucz models (lower panel). The symbols are the same as in Fig. 3. The typical error of each measurement is plotted in the upper left corner.
Current usage metrics show cumulative count of Article Views (full-text article views including HTML views, PDF and ePub downloads, according to the available data) and Abstracts Views on Vision4Press platform.
Data correspond to usage on the plateform after 2015. The current usage metrics is available 48-96 hours after online publication and is updated daily on week days.
Initial download of the metrics may take a while.