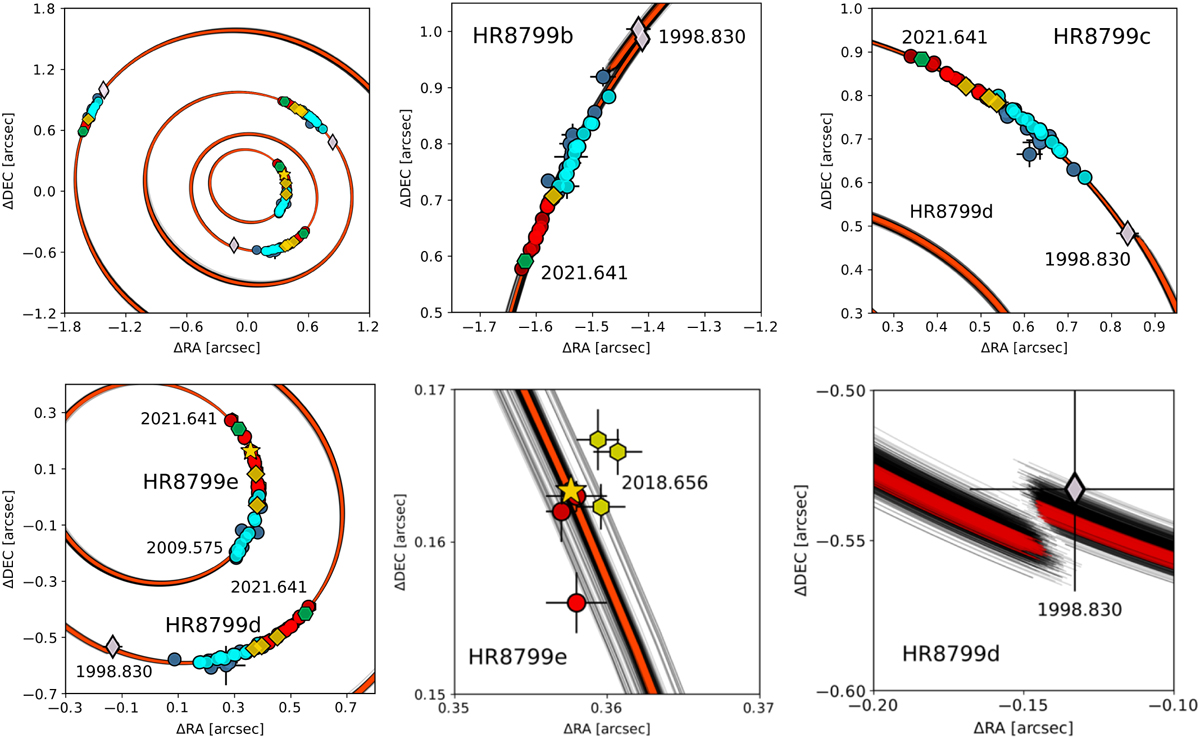
Fig. 4
Download original image
Best-fitting solutions to the four-planet model in Table 6 for m⋆ = 1.47 M⊙, illustrated on the sky plane as randomly selected MCMC samples from the Δn posterior. The y-axis corresponds to the north (N), and the x-axis corresponds to the east (E) direction, respectively (we note that the numerical values of are opposite in sign with respect to the formal left-hand direction of the RA α). Red-filled circles are for the new or re-reduced IRDIS measurements in this paper, yellow hexagons are for the IFS measurements, green hexagons are for the LUCI points, light-blue filled circles are for measurements in Konopacky et al. (2016), and dark-blue circles are for data in other references collected in Tables 2, 3, and 5 and summarised in Table A.1. Diamonds are for the GPI data, and a star symbol is for the most accurate GRAVITY point. Red curves mark stable solutions with the lowest RMS ≃ 7.6–8 mas, randomly selected from the MCMC samples, and darker grey curves are for other orbital arcs derived for stable models up to RMS ≃ 9–10 mas. All model orbits have been derived for all measurements available to date, and cover roughly one osculating orbital period for every planet, respectively. The osculating epoch is 1998.830. We also labeled the observational epochs encompassing the orbital arcs with data. The upper left panel is for the global view of the system on the sky plane, and subsequent panels are for its close-ups and interesting regions.
Current usage metrics show cumulative count of Article Views (full-text article views including HTML views, PDF and ePub downloads, according to the available data) and Abstracts Views on Vision4Press platform.
Data correspond to usage on the plateform after 2015. The current usage metrics is available 48-96 hours after online publication and is updated daily on week days.
Initial download of the metrics may take a while.