Fig. 7
Download original image
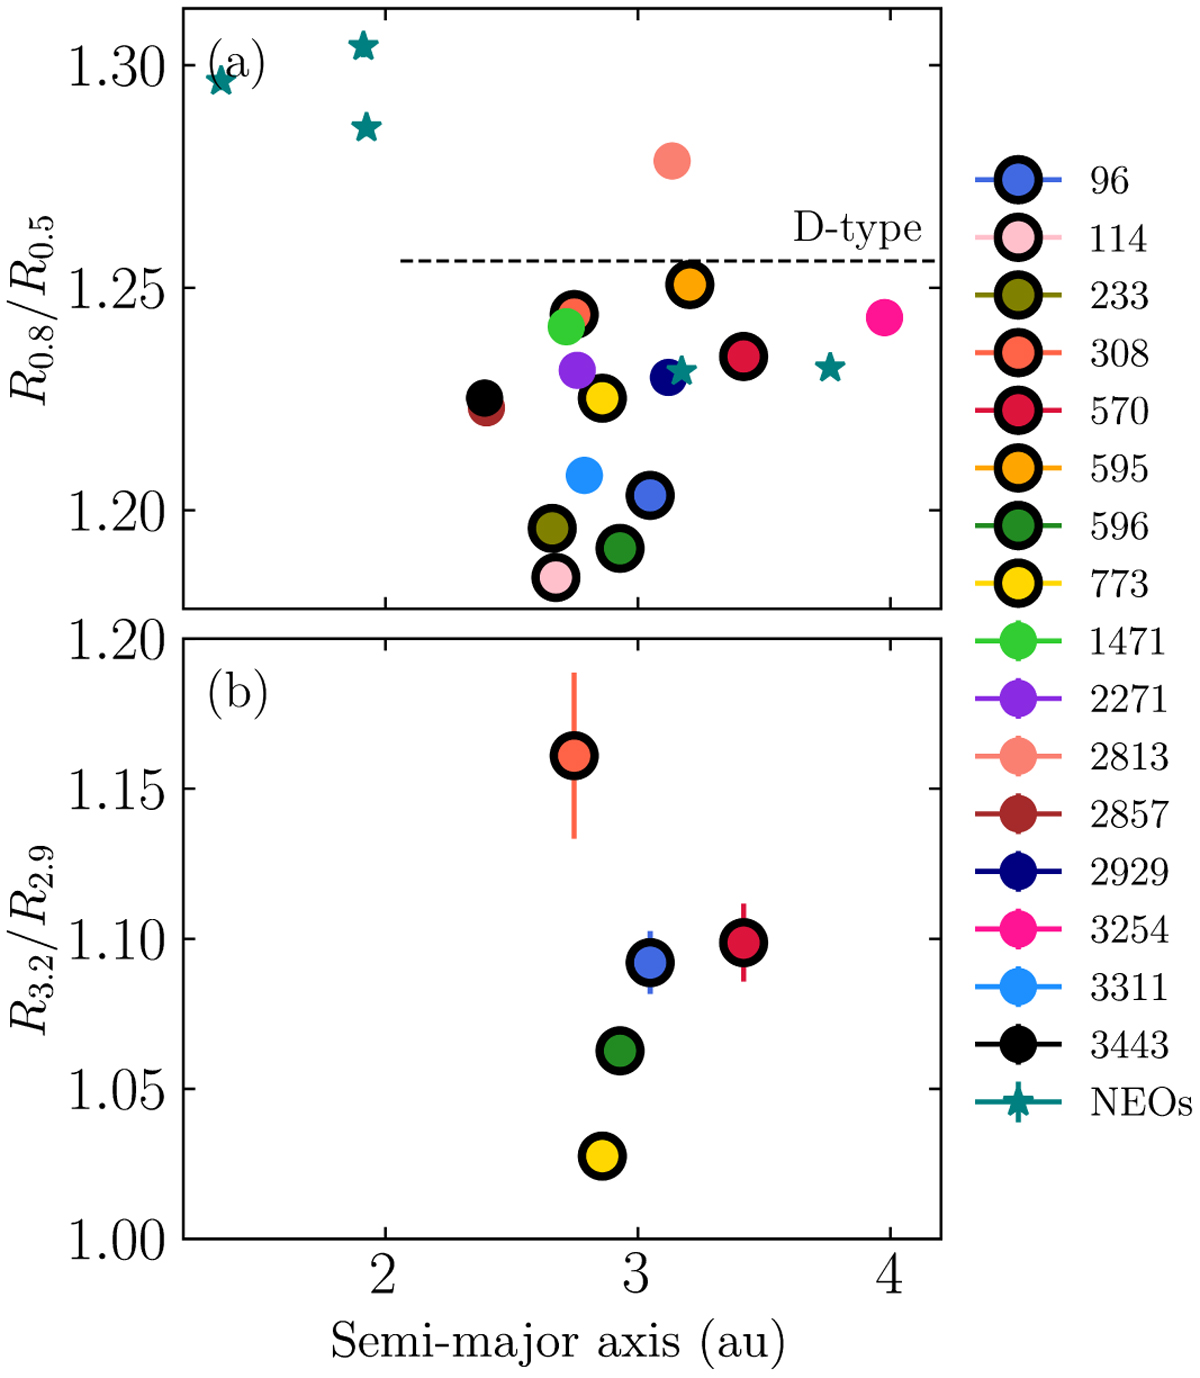
Distribution of the reflectance ratios of T types as a function of semi-major axes. The ratios of the reflectances measured at 0.8 µm and 0.5 µm (R0.8/R0.5) and at 3.2 µm and 2.9 µm (R3.2/R2.9) are shown in panels a and b, respectively. Circles with thick black edges denote asteroids whose diameter is greater than 80 km, and circles without edges mark smaller ones (<50 km). Stars represent five T types in near-Earth orbits: (85490) 1997 SE5, (138911) 2001 AE2, (162998) 2001 SK162, 2001 UU92, and 2001 YE1. The horizontal line in panel a denotes the R0.8 /R0.5 of the mean reflectance of D types (DeMeo et al. 2009; Fig. 1).
Current usage metrics show cumulative count of Article Views (full-text article views including HTML views, PDF and ePub downloads, according to the available data) and Abstracts Views on Vision4Press platform.
Data correspond to usage on the plateform after 2015. The current usage metrics is available 48-96 hours after online publication and is updated daily on week days.
Initial download of the metrics may take a while.