Fig. 6
Download original image
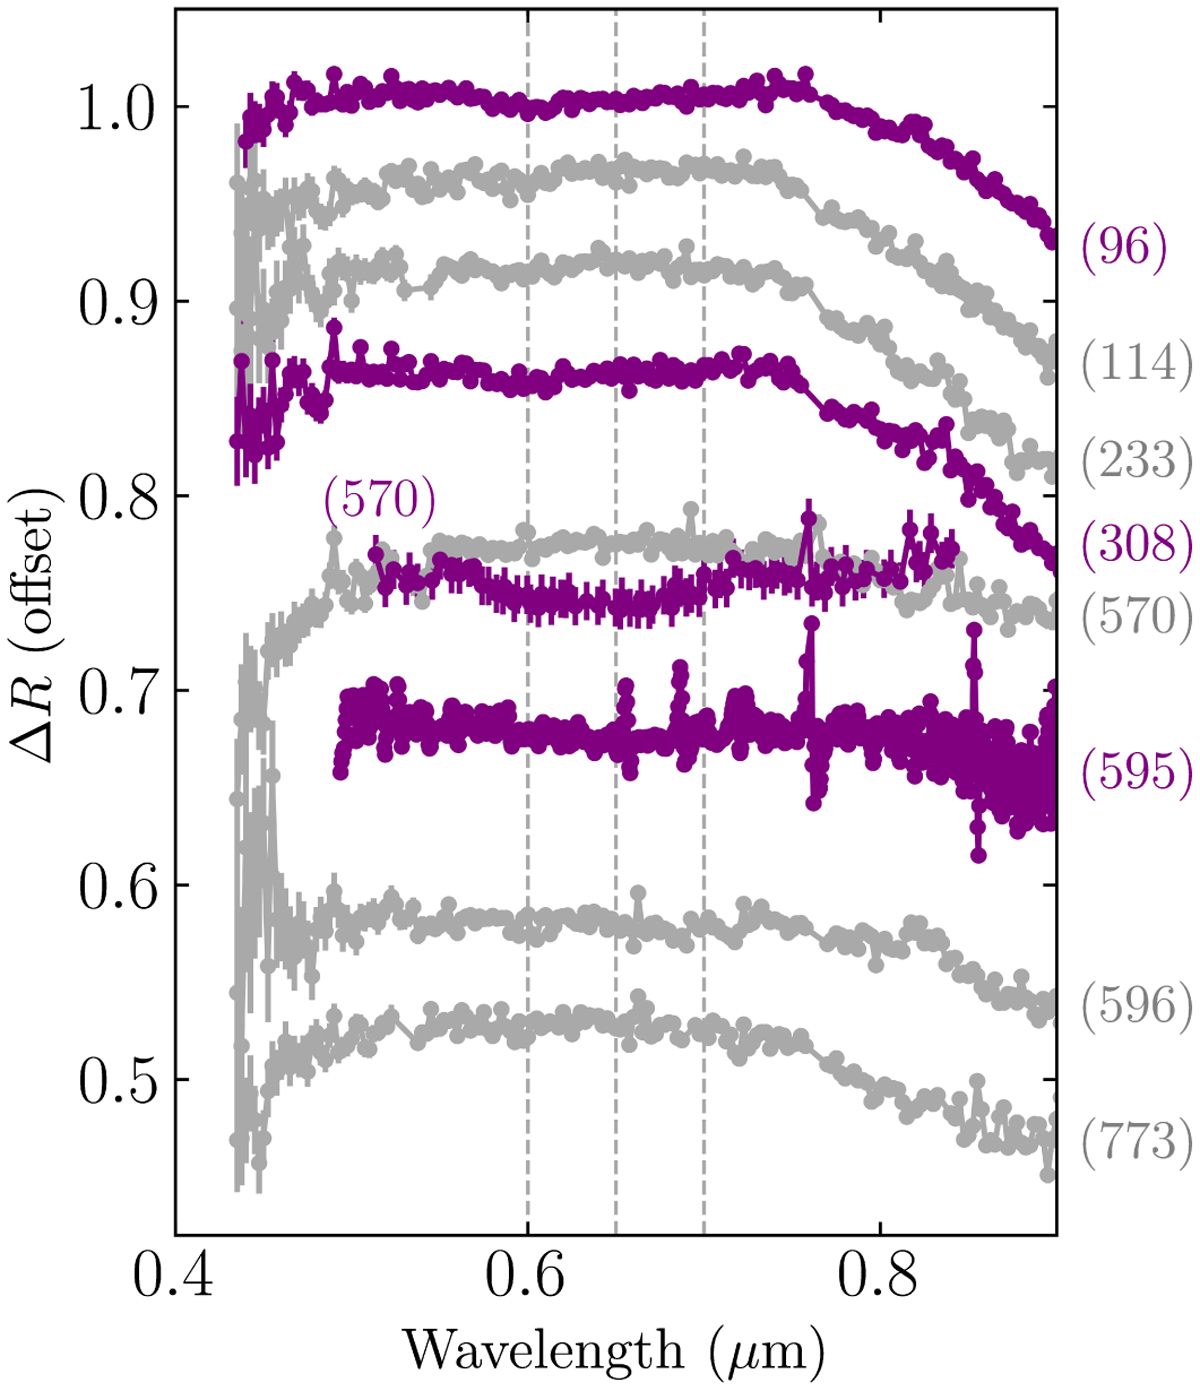
Continuum-removed spectra of all currently known large T types (Table A.1). The continuum was fitted by a linear function using data points at ~0.44−0.55 and ~0.72−0.76 µm (exact start and end points of the wavelengths were adjusted depending on the spectral curvature of the asteroids). Each was normalised at 0.55 µm and offset for clarity. Positive and negative detections of the 0.7 feature were coloured in purple and grey, respectively.
Current usage metrics show cumulative count of Article Views (full-text article views including HTML views, PDF and ePub downloads, according to the available data) and Abstracts Views on Vision4Press platform.
Data correspond to usage on the plateform after 2015. The current usage metrics is available 48-96 hours after online publication and is updated daily on week days.
Initial download of the metrics may take a while.